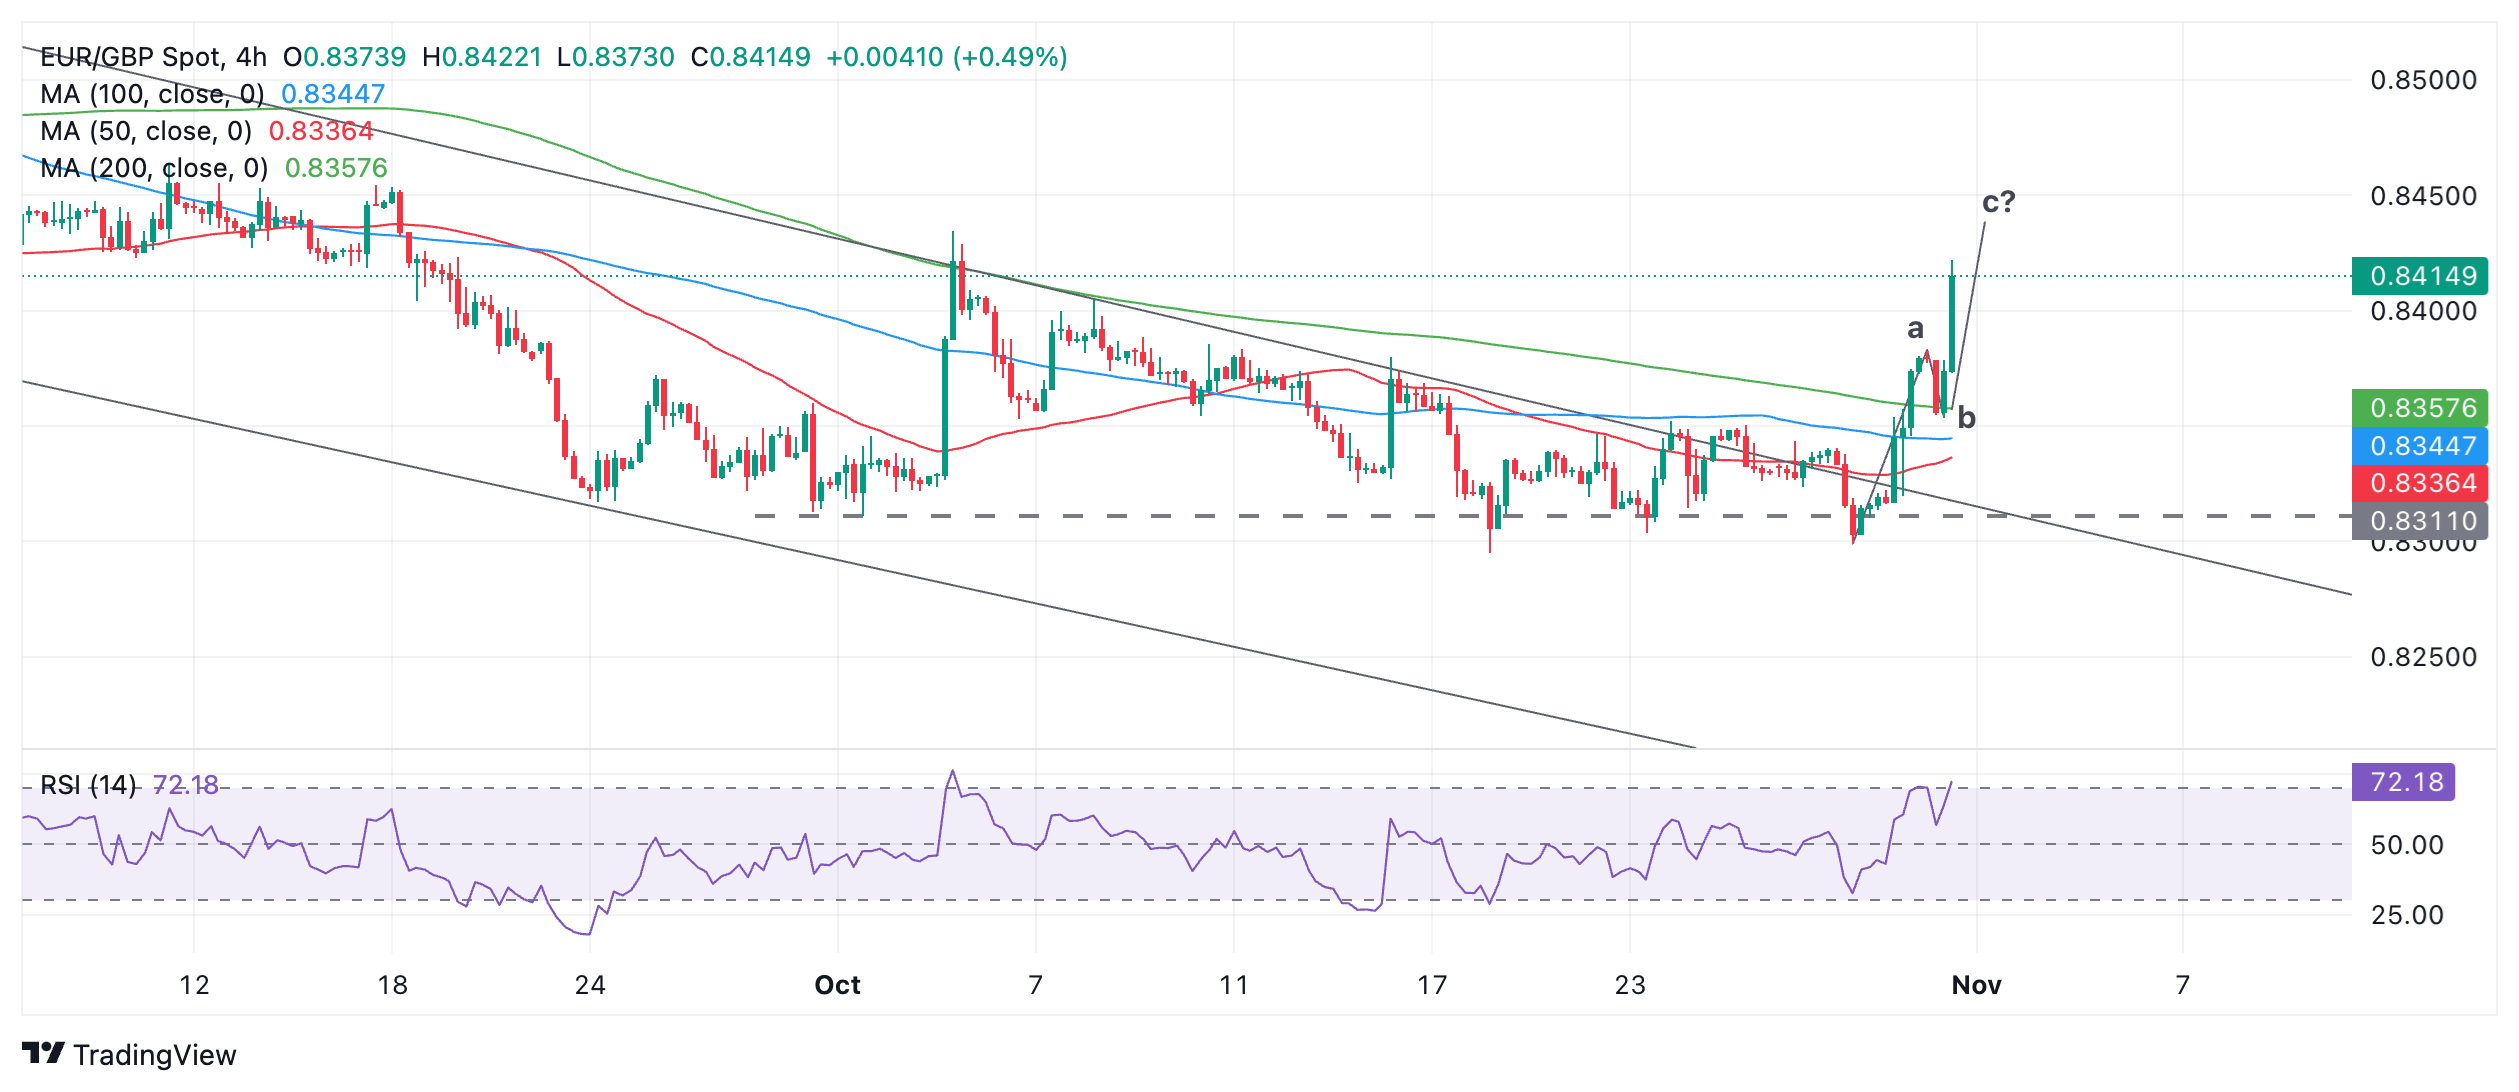
- EUR/GBP bounces off key lows and rallies strongly.
- Too soon to say whether the pair is reversing trend or correcting, however, upside is strong so far.
EUR/GBP has bounced off key support (gray dashed line) at multi-year lows and risen over a percentage point to trade above 0.8400 on Thursday.
EUR/GBP 4-hour Chart

The pair has risen very steeply over the last two days and this could be a sign the short-term trend is reversing and turning higher. If so the bias will be to the upside given the technical analysis principle that “the trend is your friend”. It is too early to be sure this is the case however.
It is also possible to characterize EUR/GBP as merely correcting back and forming a common three-wave abc correction in the process. This would imply price will roll over after wave c ic completed and possibly even fall back down to the 0.8300 lows.
The speed and strength of the rally over the last 48 hours, however, suggests EUR/GBP may not just be forming an abc correction, but that it could be completely reversing trend and turning bullish. Ultimately, evidence is required to be confident of such a reversal.
The Relative Strength Index (RSI) momentum indicator entered the overbought zone (above 70) this period, however, we will not know whether it remains there until the current candle closes. At the moment that looks likely.
If RSI closes above 70 then it will be a sign for long-holders not to add to their positions, since there is a material risk of the price pulling back.


