
- Dogecoin’s rounding bottom reversal rally surpasses the 200-day EMA, targeting $0.2145.
- Shiba Inu edges higher by over 4%, trading above the 100-day EMA as the bullish momentum increases.
- Pepe’s uptrend gains momentum with over 6% surge so far on Monday amid rising chances of a golden crossover.
Meme coins such as Dogecoin (DOGE), Shiba Inu (SHIB), and Pepe (PEPE) post gains of over 4% at press time on Monday, tracking Bitcoin’s (BTC) upward move above $122,000. As investors’ risk appetite improves, a diversified capital inflow toward meme coins increases the segment’s market capitalization above $69 billion.
With the prevailing uptrend of DOGE, SHIB, and PEPE gaining traction, traders anticipate an extended rally. The technical outlook indicates a bullish inclination if the meme coins uphold momentum.
Dogecoin’s recovery run reclaims $0.20
Dogecoin appreciates over 4% at press time on Monday, and exceeds the 200-day Exponential Moving Average (EMA) at $0.2028 following a rounding bottom reversal.
A decisive daily close above the dynamic line would extend the uptrend in DOGE towards $0.2145 resistance level last tested on Friday. If DOGE pushes past this level, it could target the $0.2500 psychological level, followed by the May 11 high of $0.2597.
The technical indicators point to increased bullish momentum as the Relative Strength Index (RSI) reads 67 on the daily chart, slightly below the overbought zone, and the Moving Average Convergence/Divergence (MACD) indicator displays a surge in histogram bars above the zero line.
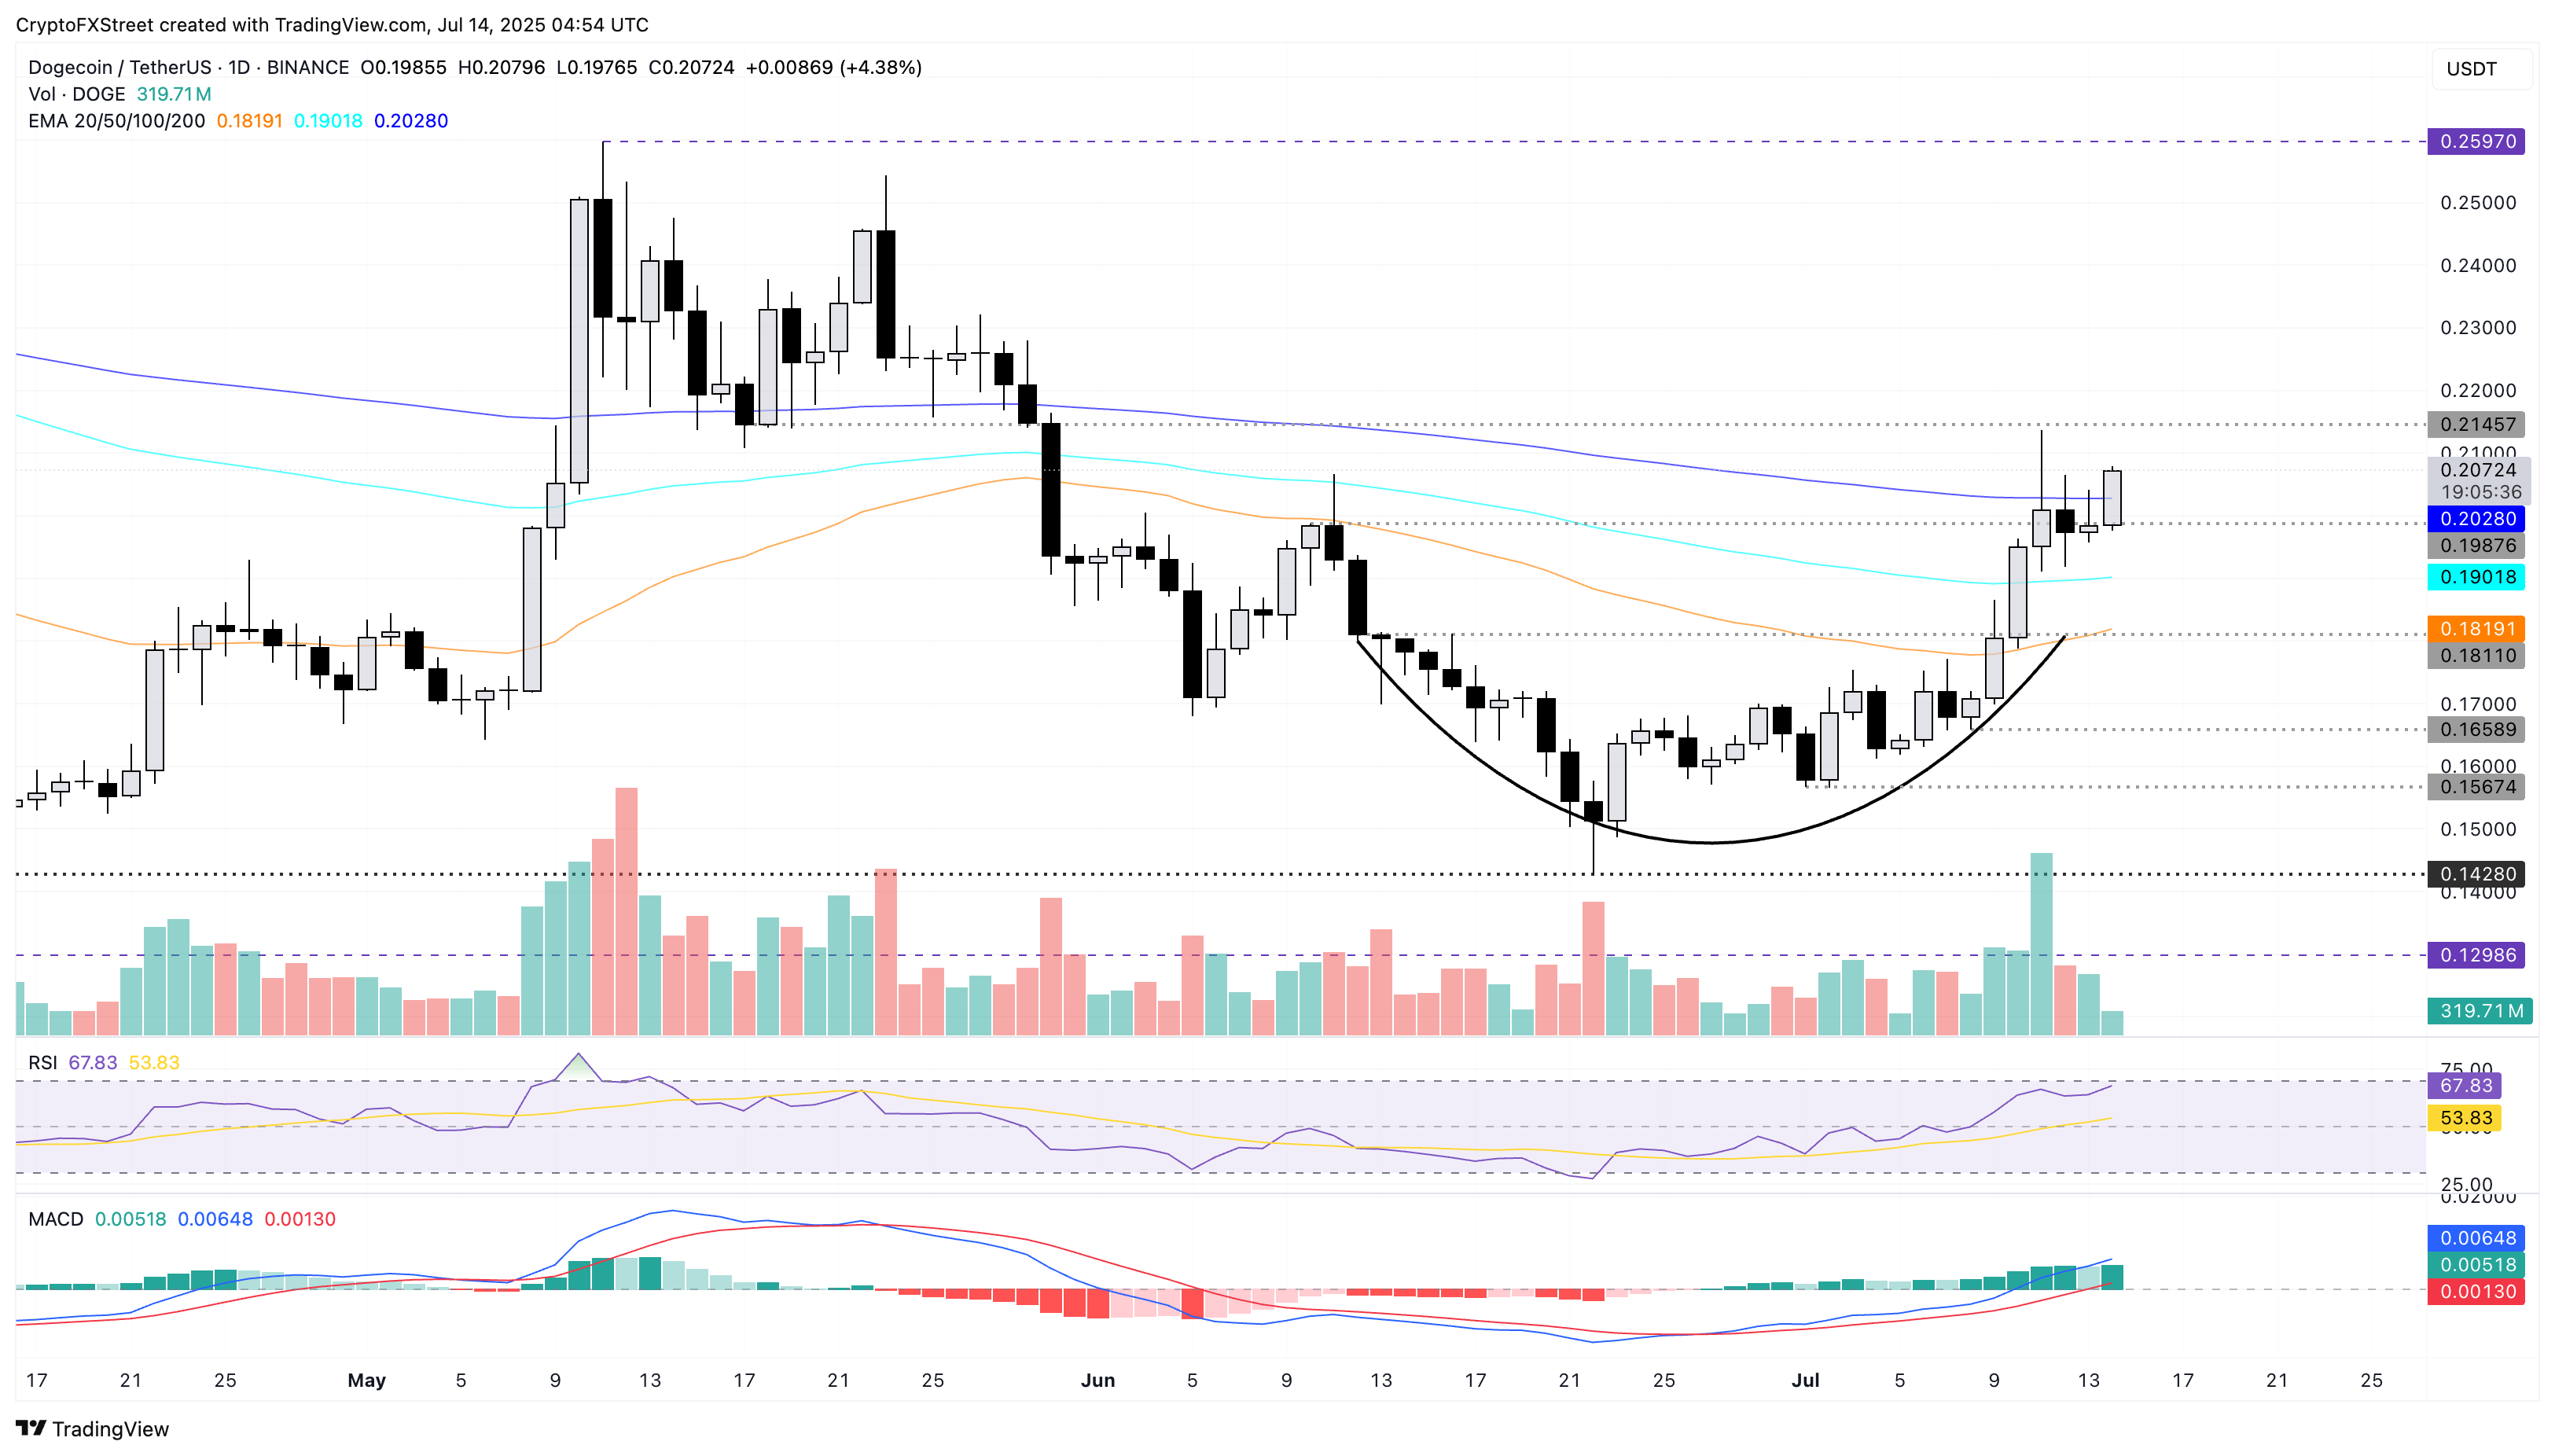
DOGE/USDT daily price chart.
However, if Dogecoin fails to uphold above the 200-day EMA at $0.2028, it could extend the decline to the 100-day EMA at $0.1901.
Shiba Inu eyes further gains amid rising bullish momentum
Shiba Inu bounces off the 100-day EMA by over 4% at the time of writing on Monday, hinting at a bullish start to the week. The recovery run gains traction after multiple Doji candles since Friday, as SHIB retested the 100-day EMA.
The meme coin targets the immediate resistance of $0.00001421, which previously acted as a crucial support level in late May. With a daily close above this level, investors could target the $0.00001567 level last tested on May 23, while the 200-day EMA at $0.00001452 remains a short-term resistance.
The RSI reads 68 on the daily chart, inching closer to the overbought zone, while the MACD indicator shows a surge in bullish momentum with the rising histogram bars above the zero line.
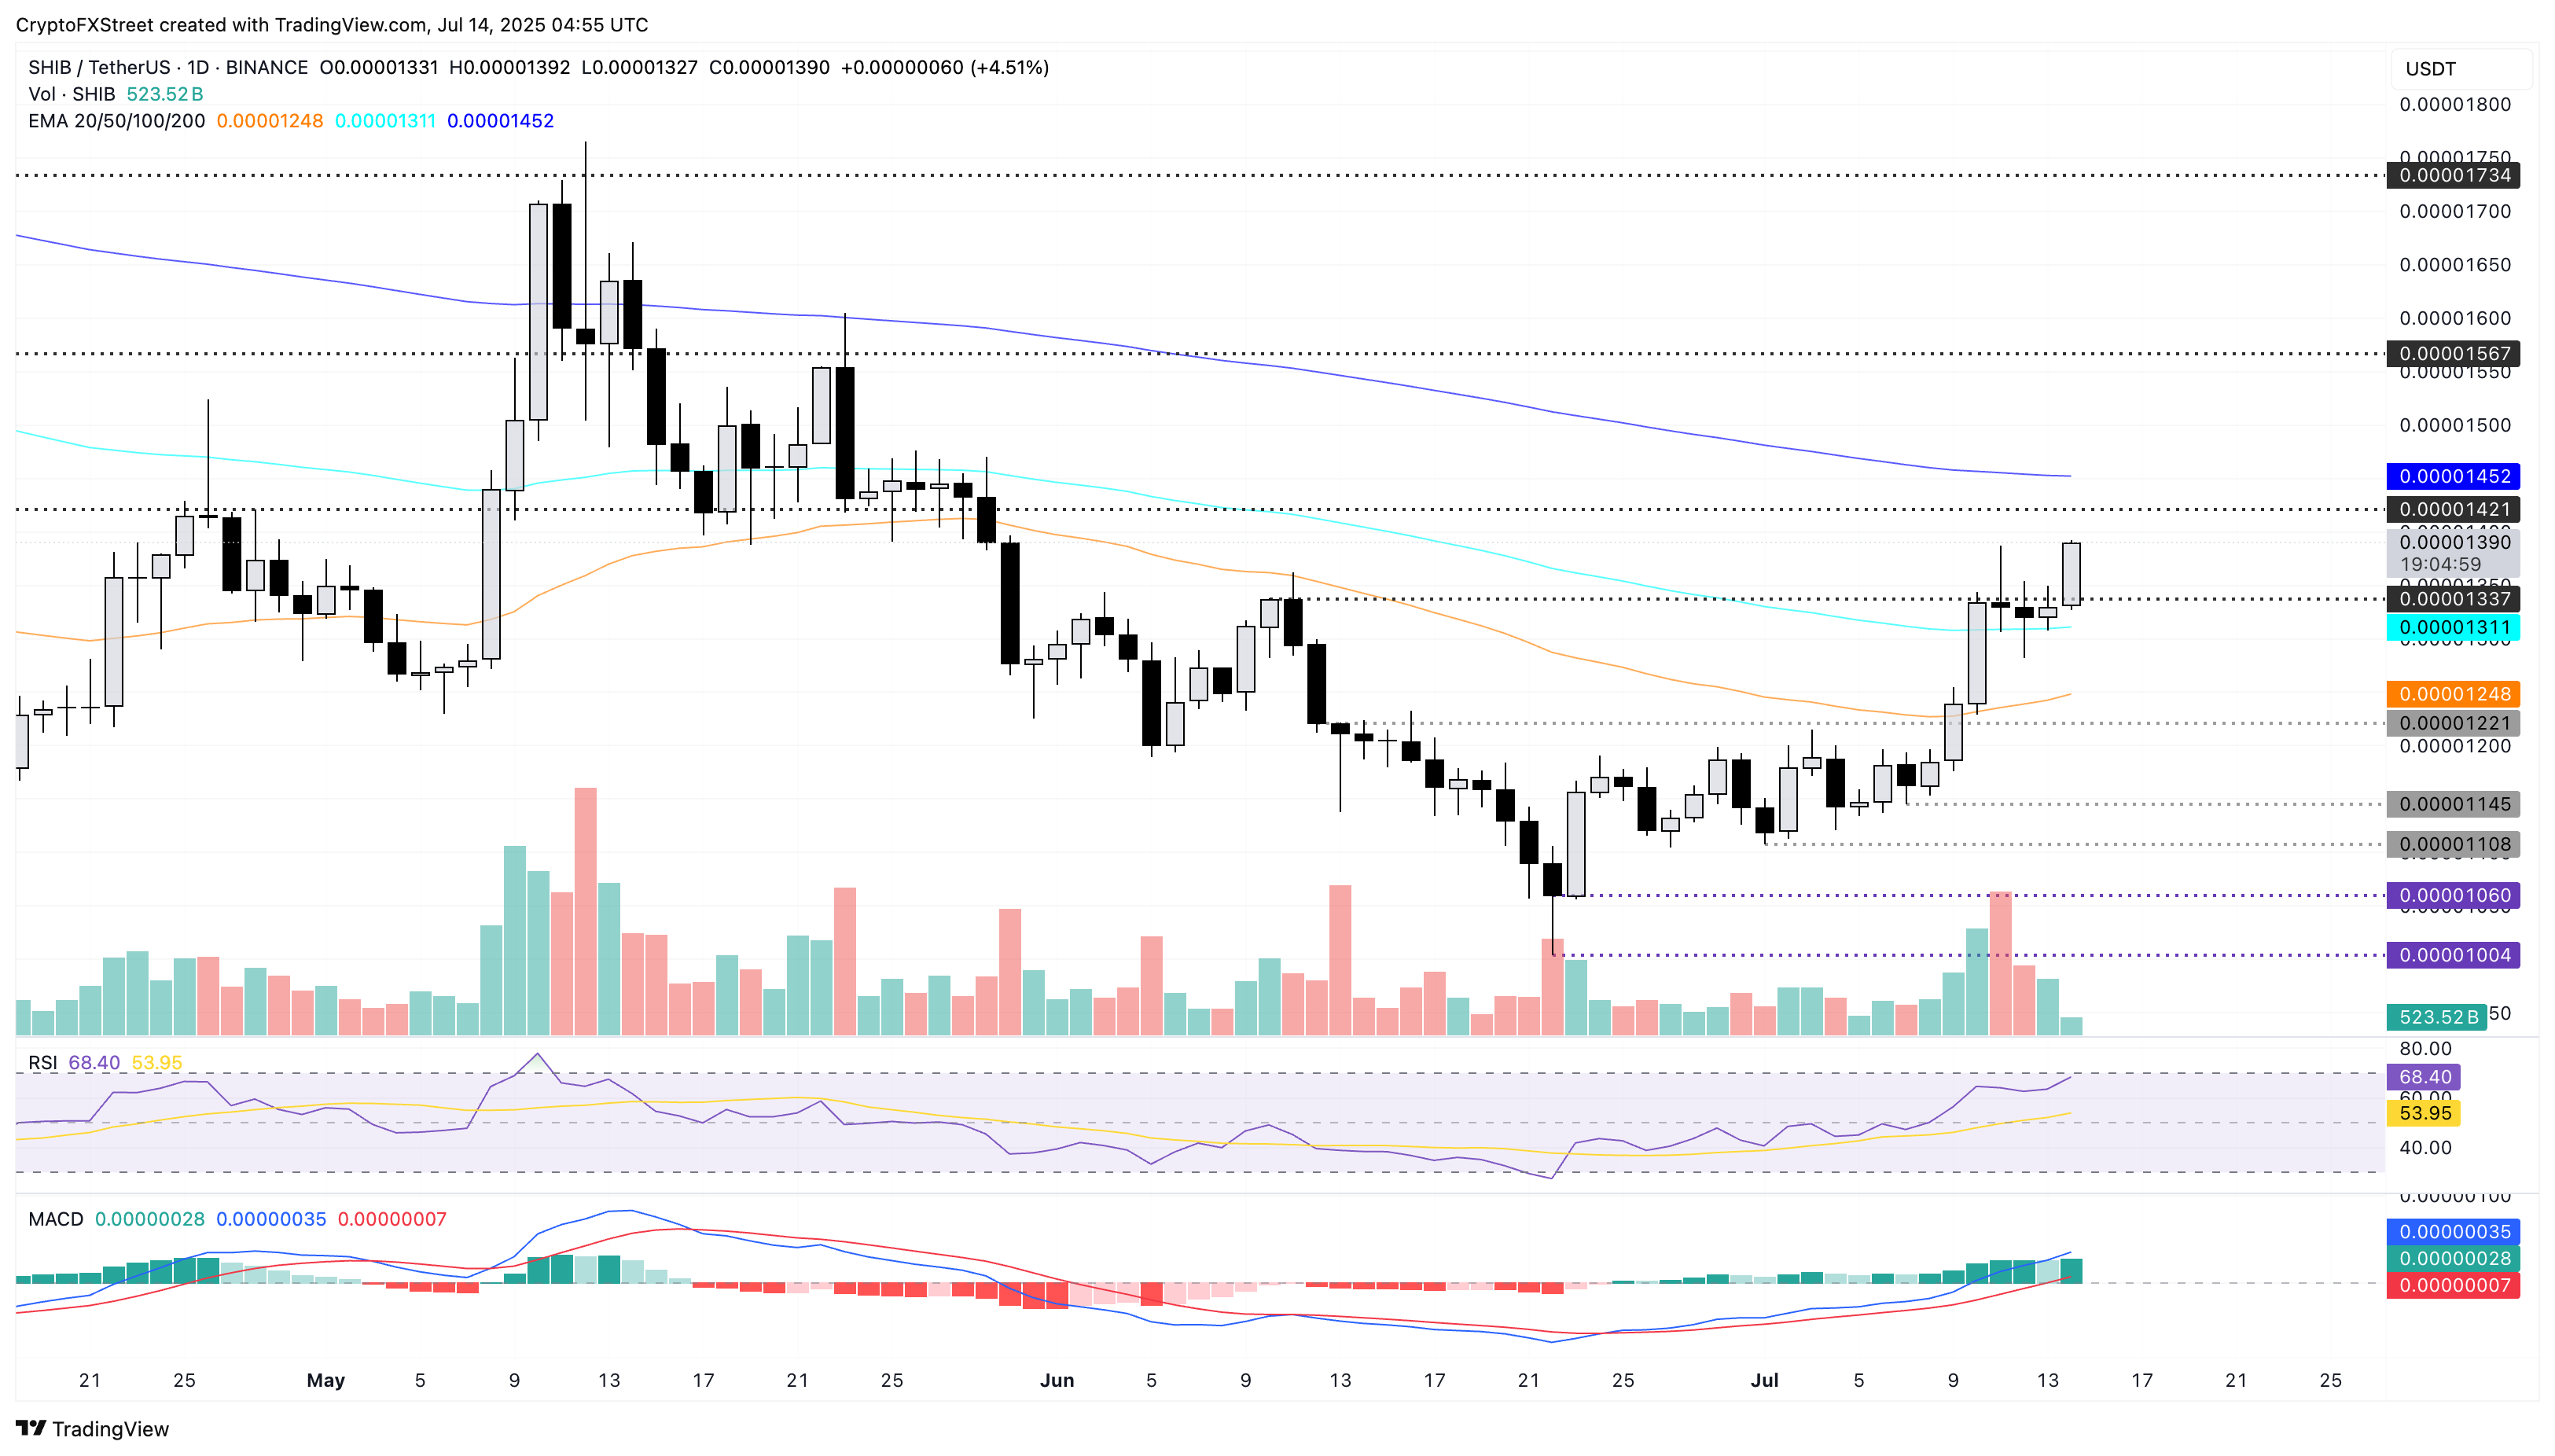
SHIB/USDT daily price chart.
If SHIB corrects and closes below the 100-day EMA, it could retest the 50-day EMA at $0.00001248.
PEPE’s golden crossover hints at an extended rally
Pepe leads the rally among top meme coins with a 6% surge at press time on Monday, following a silent weekend marked by Doji candles near $0.00001200. Pepe’s recent descending triangle breakout rally gains traction amid increasing bullish signals on the daily chart.
If Pepe exceeds the $0.00001362 resistance level last tested on June 10, it could stretch the rally towards the May 23 high of $0.00001632.
Sidelined investors could consider the 50-day EMA crossing above the 200-day EMA, a sign that a short-term trend is outgrowing the longer-term slowdown. The technical indicators hold a bullish incline with the RSI at 68 nearing overbought conditions and the MACD and signal lines crossing above the zero line.
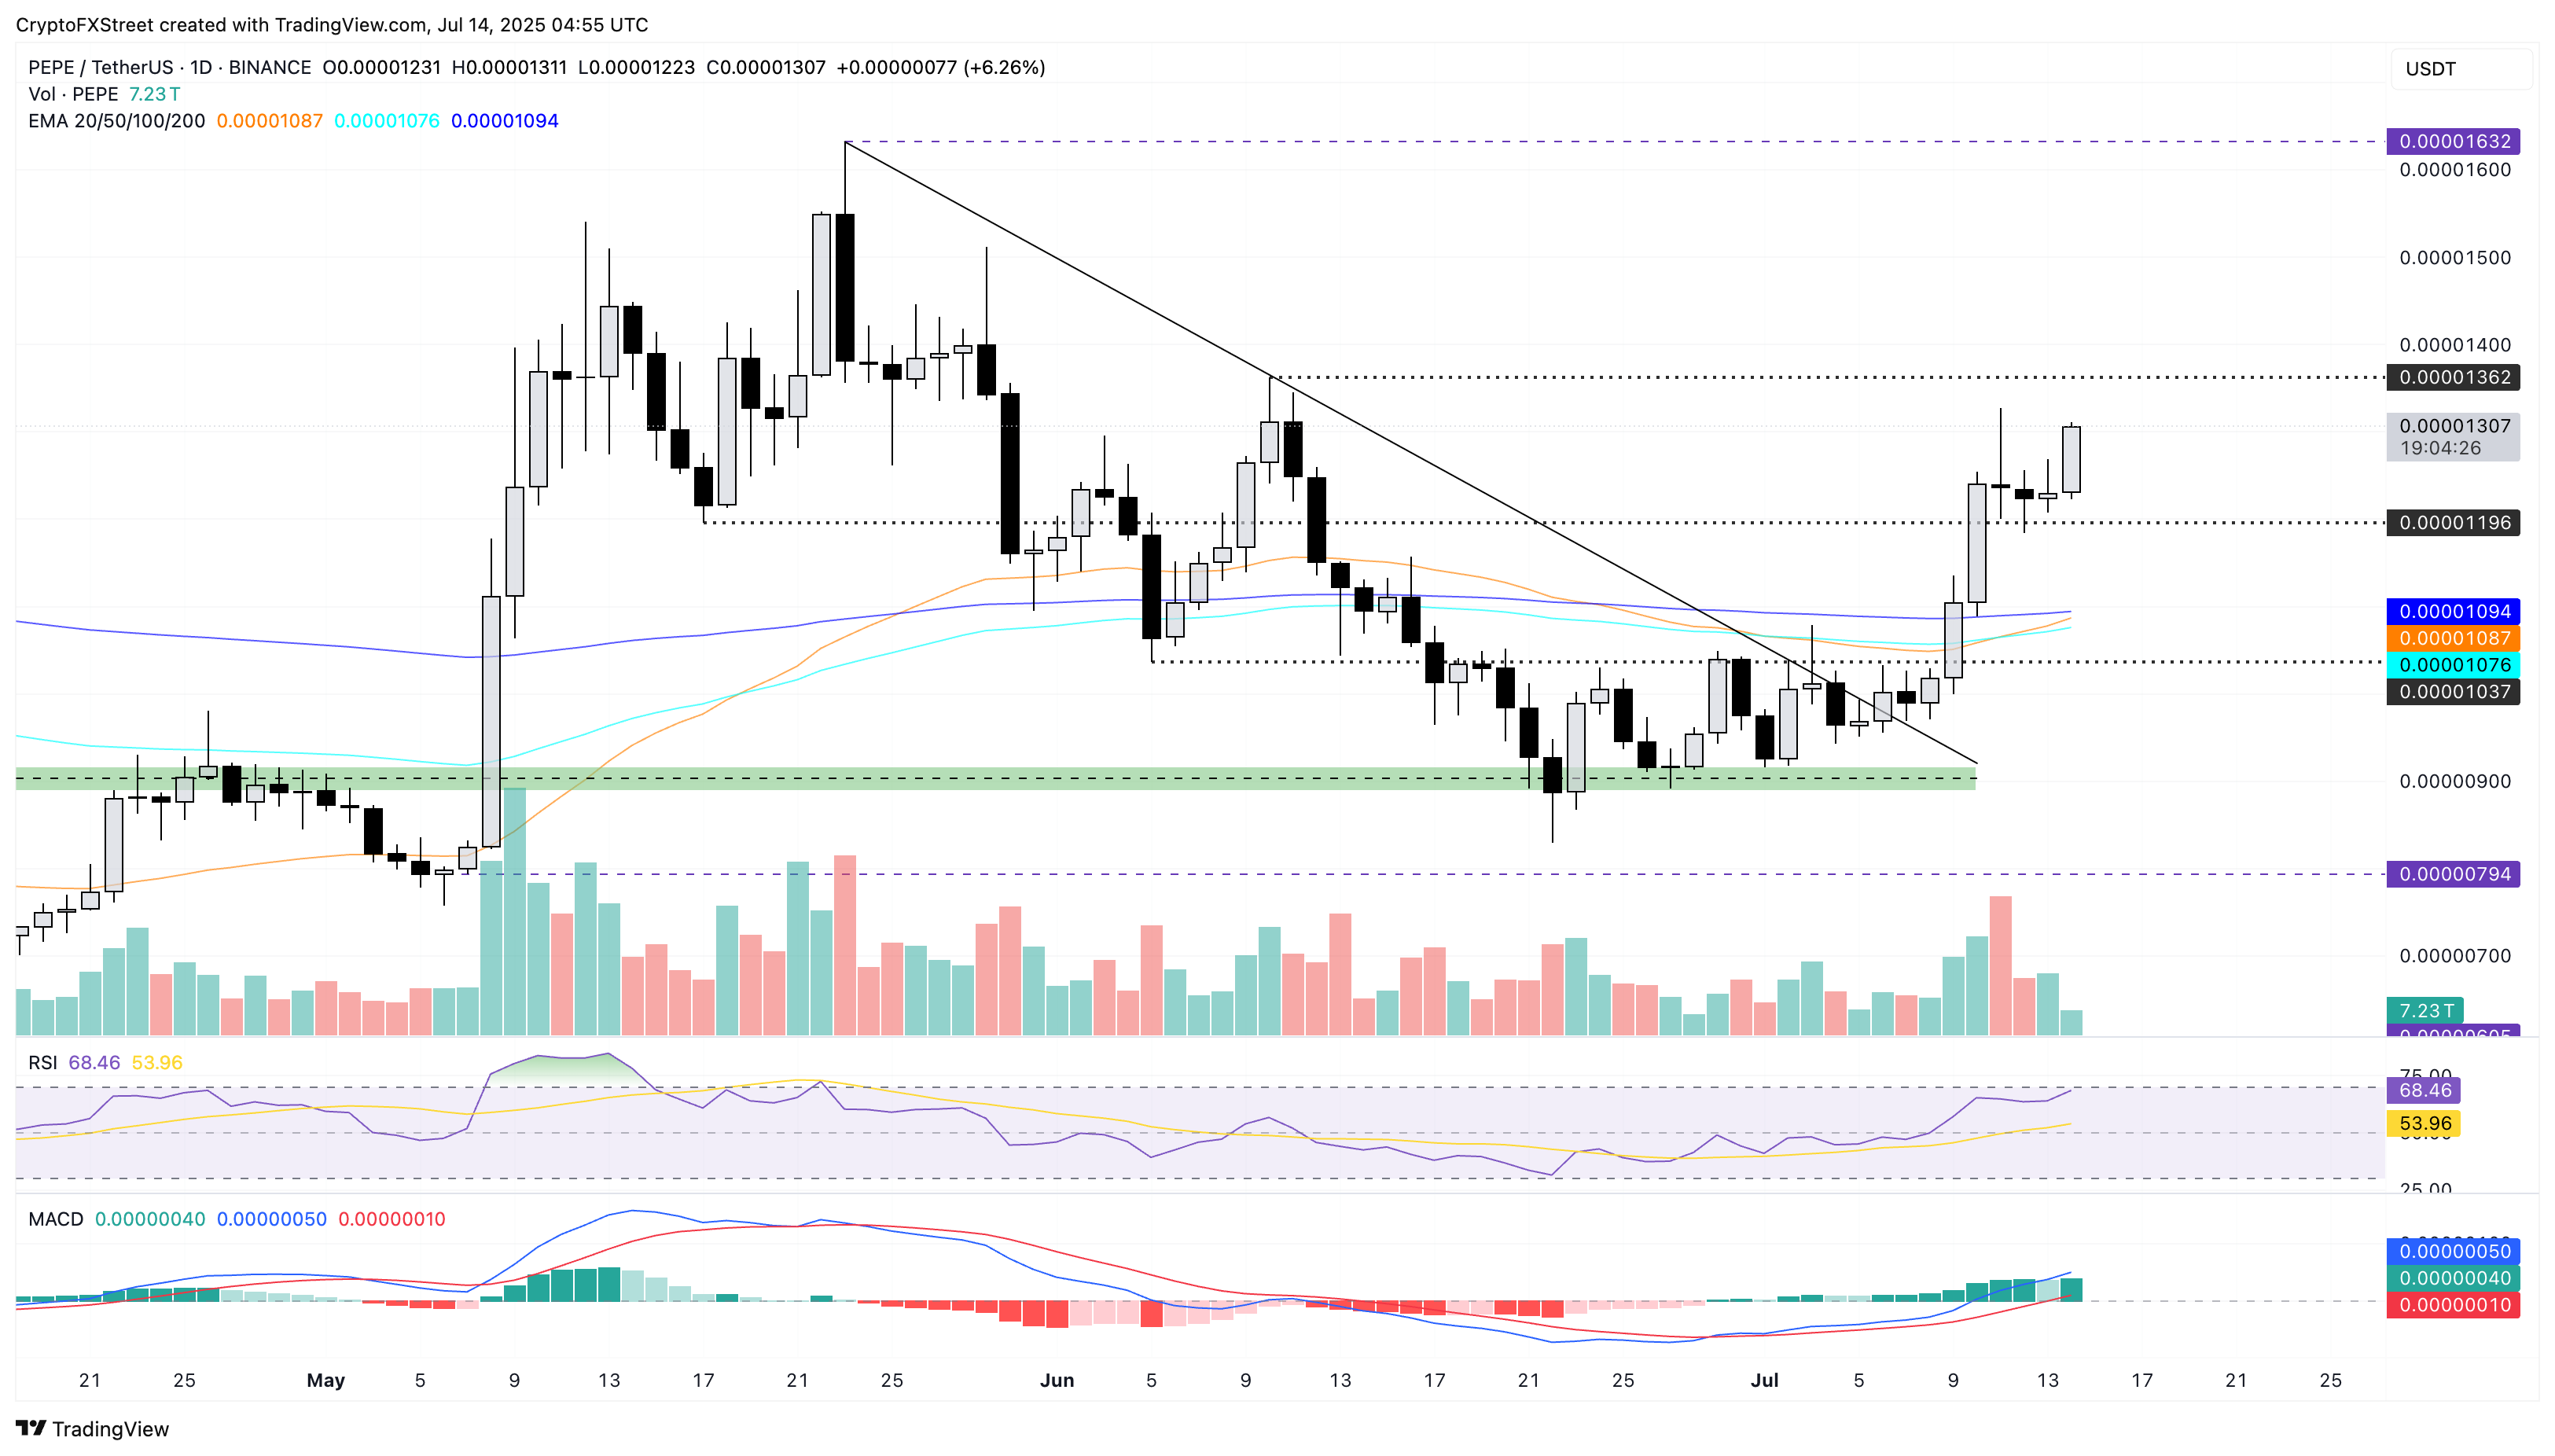
PEPE/USDT daily price chart.
On the contrary, if PEPE reverses below the $0.00001196 support level last tested on Saturday, it could extend the decline to the 200-day EMA at $0.00001094.