- Silver price has broken out of a Bear Flag pattern and met its conservative target.
- Support from a long-term support and resistance level at around $25.80 is likely to provide a floor for the sell-off.
- Despite the sell-off, the ultimate target at $25.50 for the bearish pattern has yet to be reached.
Silver (XAG/USD) price has broken out of the Bear Flag continuation price pattern it has formed on the 4-hour chart, declined and reached the conservative target for the pattern. After a bounce it has once again fallen. The precious metal looks weak in the short-term.
4-hour Chart
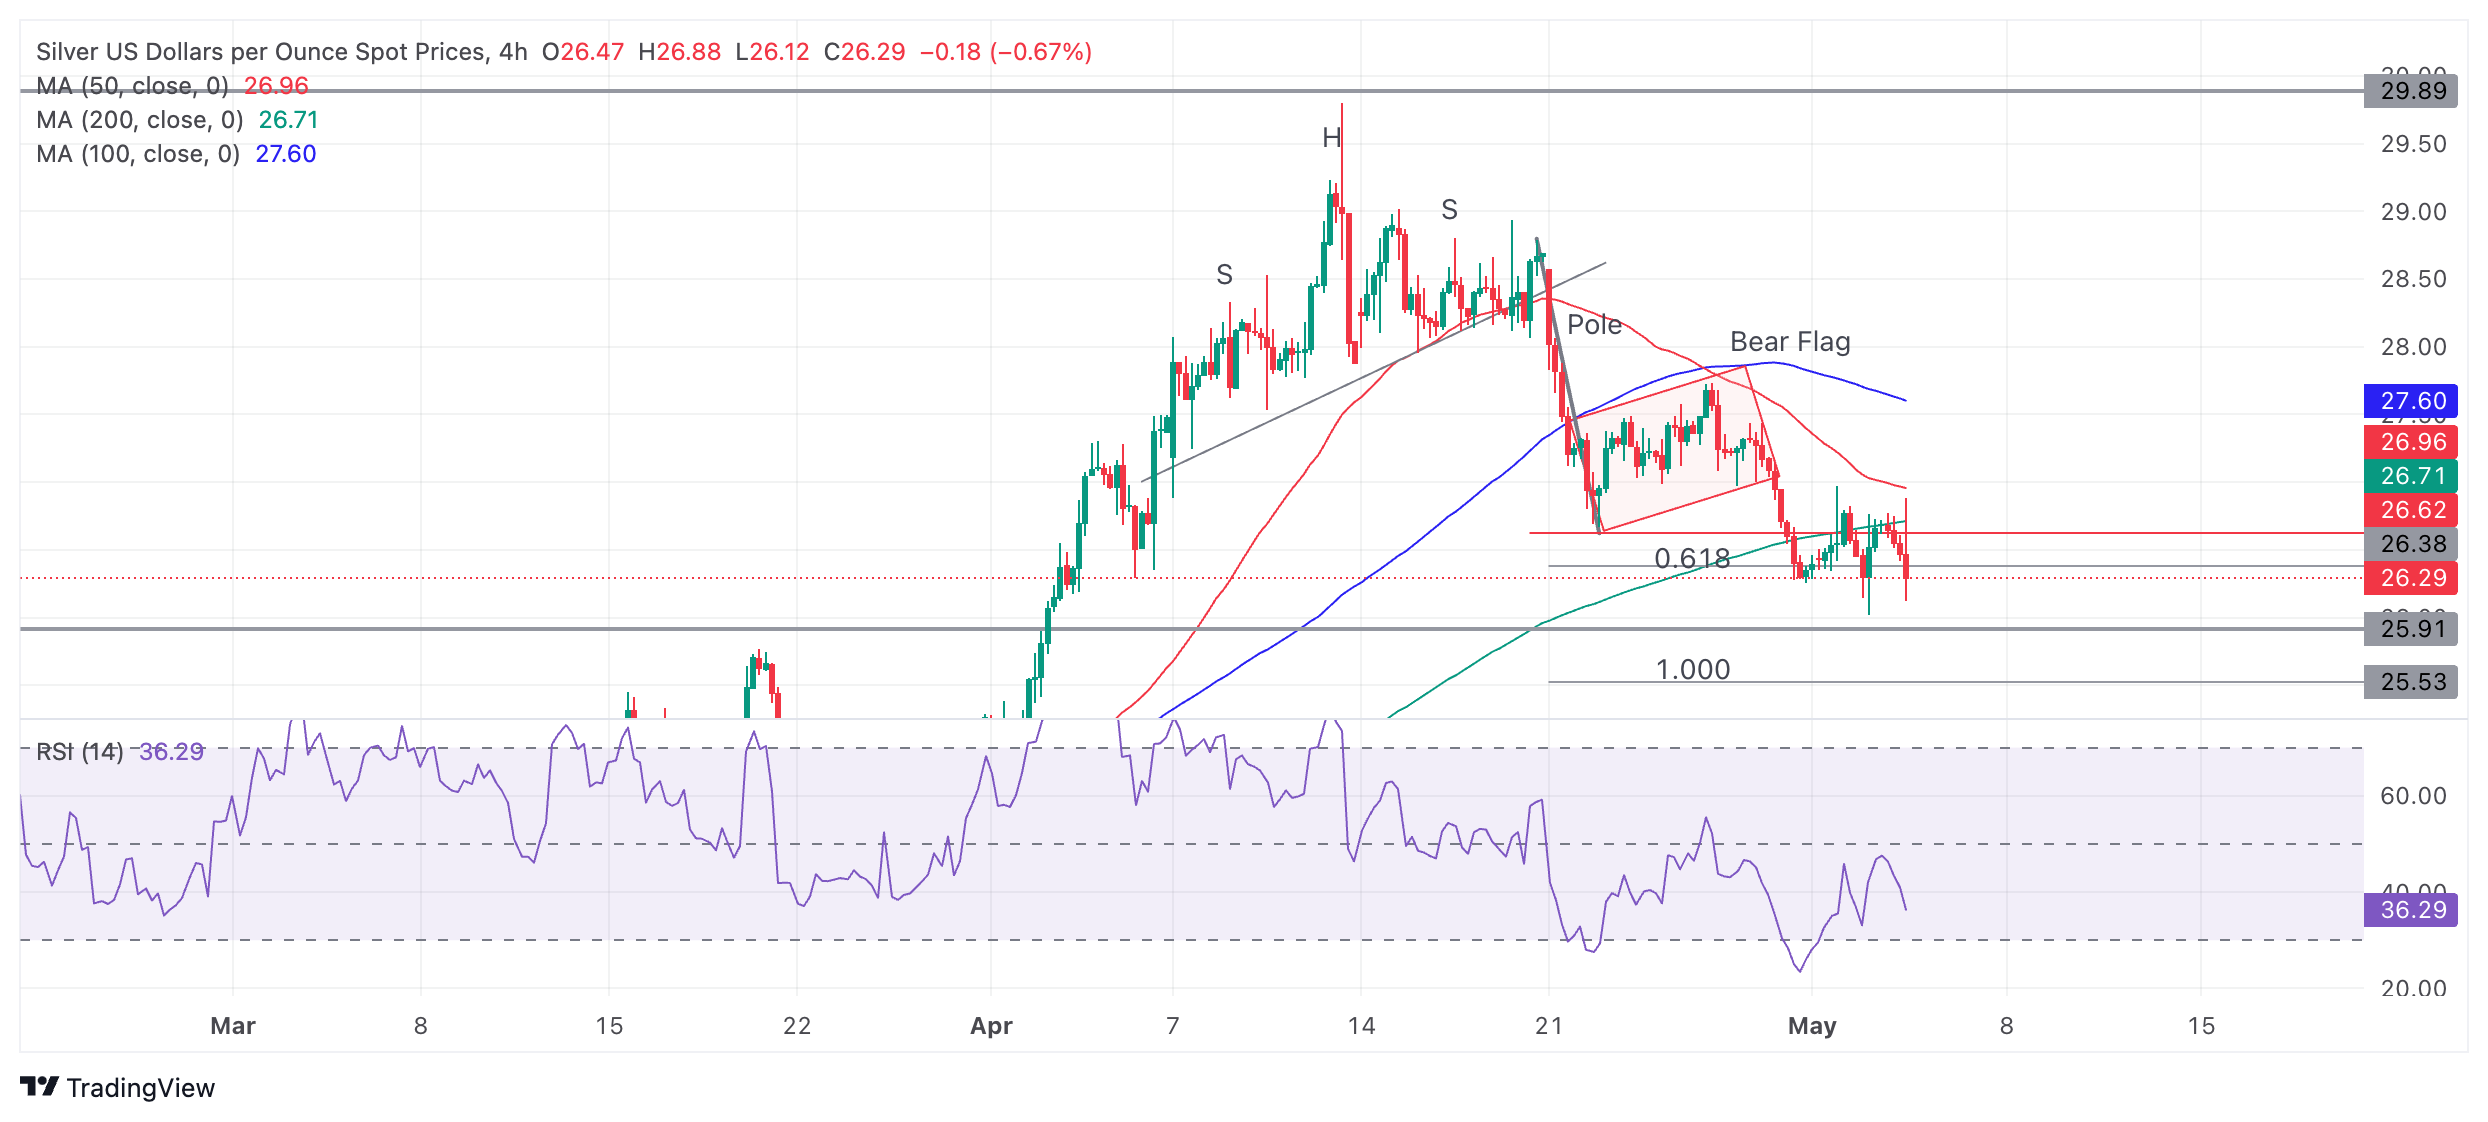
According to technical analysis theory, the expected move down from a Bear Flag is equal to the length of the preceding “pole” which in this case is the decline between April 19-23.
This gives an eventual target of around $25.50. The Fibonacci 0.618 ratio of the pole provides a conservative target at roughly $26.30 which has already been met.
Tough support from a long-term upper range boundary line at about $25.80, however, is likely to offer support.
In February Silver price started rallying up to the top of a 4-year consolidation close to $30.00. After reaching just shy of this resistance level it formed a multiple shouldered Head and Shoulders (H&S) topping pattern in mid-April.
Silver price then declined to the initial target for the H&S pattern at $26.70 and bounced. Since then it has been consolidating. The sell-off and the consolidation taken together formed a bear flag pattern, which has now broken to the downside.