- Ethereum ETFs break outflow streak with first inflows after nine days of negative flows.
- Ethereum is no longer “ultra” sound money, says analyst.
- Ethereum needs to overcome key resistance around $2,817 to validate double bottom move.
Ethereum (ETH) is down 1% on Thursday following a recent analysis showing that the top altcoin lost its “ultra” sound money narrative. Meanwhile, ETH ETFs recorded net inflows for the first time after nine days of consecutive outflows.
Daily digest market movers: Ethereum ETF outflow streak, ETH “ultra” sound money narrative
Ethereum ETFs posted inflows of $5.9 million on Wednesday, ending their nine-day streak of consecutive outflows. Inflows of $8.4 million and $1.3 million in BlackRock’s ETHA and Fidelity’s FETH, respectively, outweighed outflows of $3.8 million in Grayscale’s ETHE.
Meanwhile, several investors are increasingly concerned about ETH’s rising supply as its annual inflation rate has risen to 0.73% since the Dencun upgrade, per Ultrasound.money data.
For context, ETH’s total supply was around 120,060,000 ETH before the upgrade in March. However, supply has increased to 120,309,508 ETH in August, just five months after the upgrade, trending toward levels before the Merge in September 2022. The introduction of blobs in the Dencun upgrade reduced the workload processed on the Main chain and hence decreased the daily amount of burnt ETH.
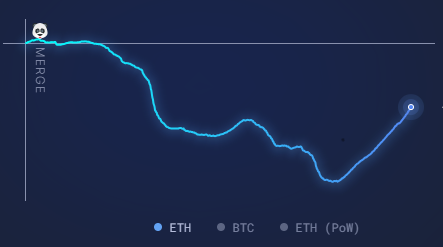
ETH Supply Growth
In an X post on Thursday, crypto analyst Thor Hartvigsen said that while ETH has become inflationary, the high supply has no negative impact on stakers as the new emissions also flows to them through staking yields. However, non-stakers bear the burden of the rising supply as they suffer a net value dilution of ~0.7. “But this is orders of magnitude lower than other L1s like Solana, Avalanche etc.,” noted Hartvigsen.
“Ethereum no longer carries the ultra sound money narrative[,] which is probably for the better. The high $100 tx fees on mainnet were never sustainable and the network is now more usable,” he added.
ETH technical analysis: Ethereum faces $2,817 resistance hurdle
Ethereum is trading around $2,510 on Thursday, down 1% on the day. In the past 24 hours, ETH liquidations declined to $18.05 million, with long and short liquidations accounting for $11.55 million and $6.5 million, respectively.
ETH is trading within a key rectangle channel, with the lower horizontal line at $2,320 as support and the upper horizontal line at $2,817 as resistance. ETH is also following the W pattern or double bottom move on the daily chart.
A daily candlestick close above the $2,817 resistance could see ETH rally toward $3,300. The 100-day Simple Moving Average (SMA) could help strengthen the bullish view as it’s attempting to cross above the 200-day SMA.
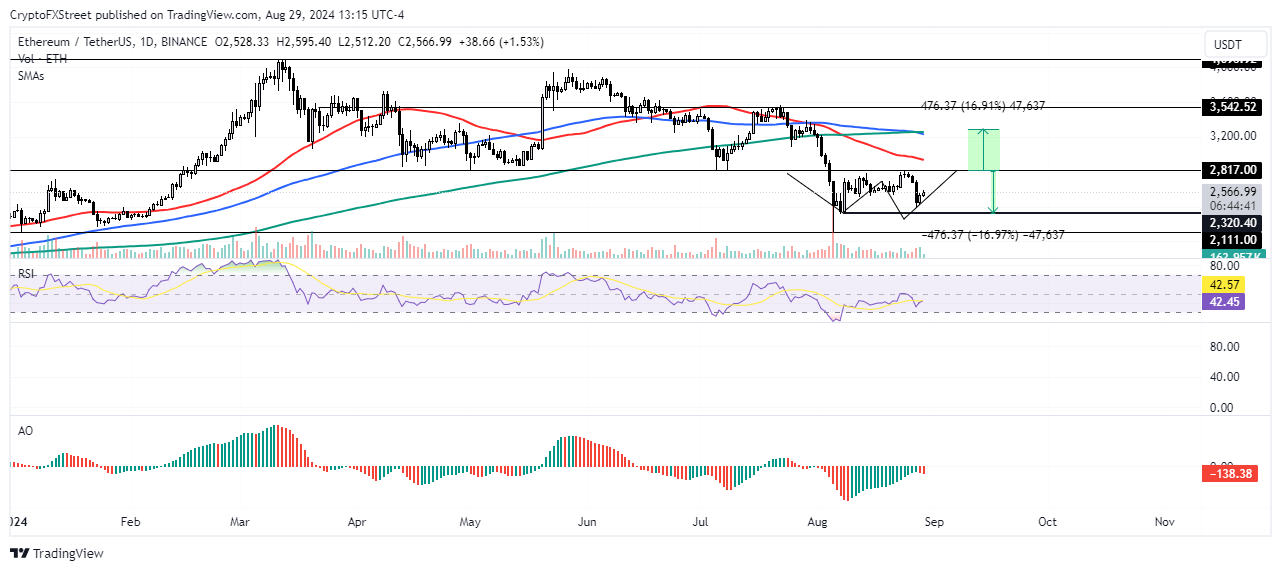
ETH/USDT Daily chart
Traders should also watch for a potential rejection around the $2,817 resistance, as ETH has retraced twice in the past few weeks — August 14 and 24 — after approaching this level.
The Relative Strength Index (RSI) is at 42, attempting to cross above its SMA. A successful completion of this move indicates short-term bullish momentum.
However, the Awesome Oscillator has flipped to red bars below the zero line, indicating the prevalence of bearish momentum in the market.
A daily candlestick close below the $2,320 support level will invalidate the bullish thesis.
Cryptocurrency metrics FAQs
The developer or creator of each cryptocurrency decides on the total number of tokens that can be minted or issued. Only a certain number of these assets can be minted by mining, staking or other mechanisms. This is defined by the algorithm of the underlying blockchain technology. Since its inception, a total of 19,445,656 BTCs have been mined, which is the circulating supply of Bitcoin. On the other hand, circulating supply can also be decreased via actions such as burning tokens, or mistakenly sending assets to addresses of other incompatible blockchains.
Market capitalization is the result of multiplying the circulating supply of a certain asset by the asset’s current market value. For Bitcoin, the market capitalization at the beginning of August 2023 is above $570 billion, which is the result of the more than 19 million BTC in circulation multiplied by the Bitcoin price around $29,600.
Trading volume refers to the total number of tokens for a specific asset that has been transacted or exchanged between buyers and sellers within set trading hours, for example, 24 hours. It is used to gauge market sentiment, this metric combines all volumes on centralized exchanges and decentralized exchanges. Increasing trading volume often denotes the demand for a certain asset as more people are buying and selling the cryptocurrency.
Funding rates are a concept designed to encourage traders to take positions and ensure perpetual contract prices match spot markets. It defines a mechanism by exchanges to ensure that future prices and index prices periodic payments regularly converge. When the funding rate is positive, the price of the perpetual contract is higher than the mark price. This means traders who are bullish and have opened long positions pay traders who are in short positions. On the other hand, a negative funding rate means perpetual prices are below the mark price, and hence traders with short positions pay traders who have opened long positions.