
- Bitcoin price must break through either $70,000 or $50,000 to decide next stable directional bias on weekly time frame.
- Ethereum price action offers bullish reversal play in the cards for 25% upside potential.
- Ripple price could climb 8% to $0.60 as XRP bulls sustain higher lows.
Bitcoin (BTC) price remains devoid of a directional bias on the higher time frames. In the lower time frames, the Relative Strength Index (RSI) on the one-day timeframe shows both bulls and bears have folded their hands. This has altcoins in a state of confusion or disarray.
Also Read: Addressing the crypto investor dilemma: To invest or not?
Cryptocurrency prices FAQs
Bitcoin price needs a stable directional bias
Bitcoin price remains range-bound between $60,660 and $70,000. It is trading horizontally and without directional bias. Based on the volume profiles, both bulls and bears are playing it safe, seeing as there are no spikes within the vicinity of the current price.
However, with the RSI above the mean level of 50 and the Awesome Oscillator (AO) in positive territory, the odds lean in favor of the upside. To confirm this directional bias, however, the bulls must haul BTC to close decisively above $70,000 on the weekly chart.

BTC/USDT 1-week chart
On the other hand, if bears take over the market amid falling momentum shown by the nose-diving RSI, Bitcoin price could drop below $60,660. In a dire case, the dump could send BTC to the $50,000 threshold, below which the bullish bias would be invalidated.
Also Read: Bitcoin price consolidates as buyer momentum flatlines, but MicroStrategy tops BTC ownership list
Ethereum price has 25% upside potential up its sleeve
Ethereum price could make a 25% run north if the descending wedge pattern, a bullish reversal technical formation, is activated. For this to happen, either of two scenarios must take place. First, Bitcoin price must give a clear directional bias that bodes well for altcoins, or secondly, altcoins must suck liquidity from Bitcoin price to initiate an alt season.
A 25% climb above the breakout point for Ethereum price will send ETH to $4,250. For this to happen, however, ETH bulls must clear the resistance order block due to the volume spikes near $3,500 where a lot of bearish activity is waiting to descend on ETH.
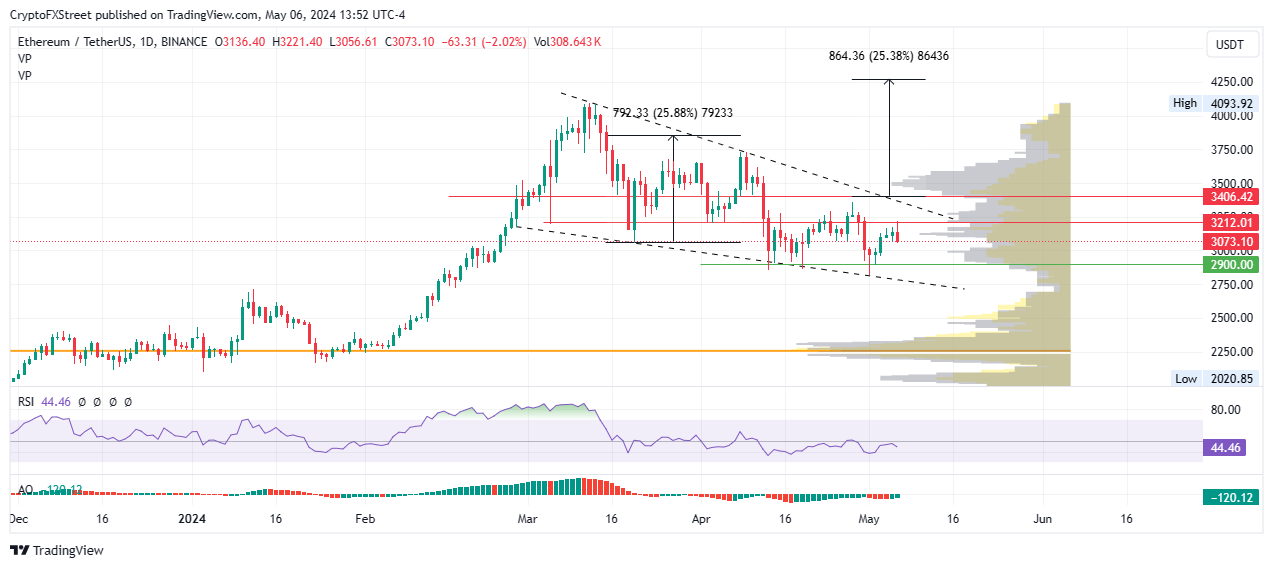
ETH/USDT 1-day chart
On the other hand, increased selling pressure could send Ethereum price below the $2,900 support. In a dire case where ETH records a lower low below $2,800, the bullish thesis would be negated.
Also Read: Ethereum could see a brief rally despite Michael Saylor’s jab at ETH ETFs
Ripple price eyes $0.60
Ripple price recorded an intraday high of $0.5703 on Monday with the potential for more gains as XRP bulls continue to show strength. If bulls manage a stable move above the peak of the market range at $0.5715, it would clear the path for a continuation of the uptrend above the 50% Fibonacci placeholder of the larger market range at $0.5847. This could set the tone for Ripple price to test the $0.6000 psychological level, nearly 10% above current levels.
The RSI continues to record higher lowers, signifying growing bullish strength. A stable move and close above the 50 mean level would confirm the continuation of the uptrend.

XRP/USDT 1-day chart
On the other hand, if bears take over and profit-booking takes form, the Ripple price could extend its fall. A candlestick close below $0.4952 would encourage more sell orders. For the bullish thesis to be invalidated, however, the price must close below $0.4500 on the one-day time frame.
Also Read: Ripple lawsuit to see SEC response on Monday, XRP nears 4.5 million mark in liquidity pools