


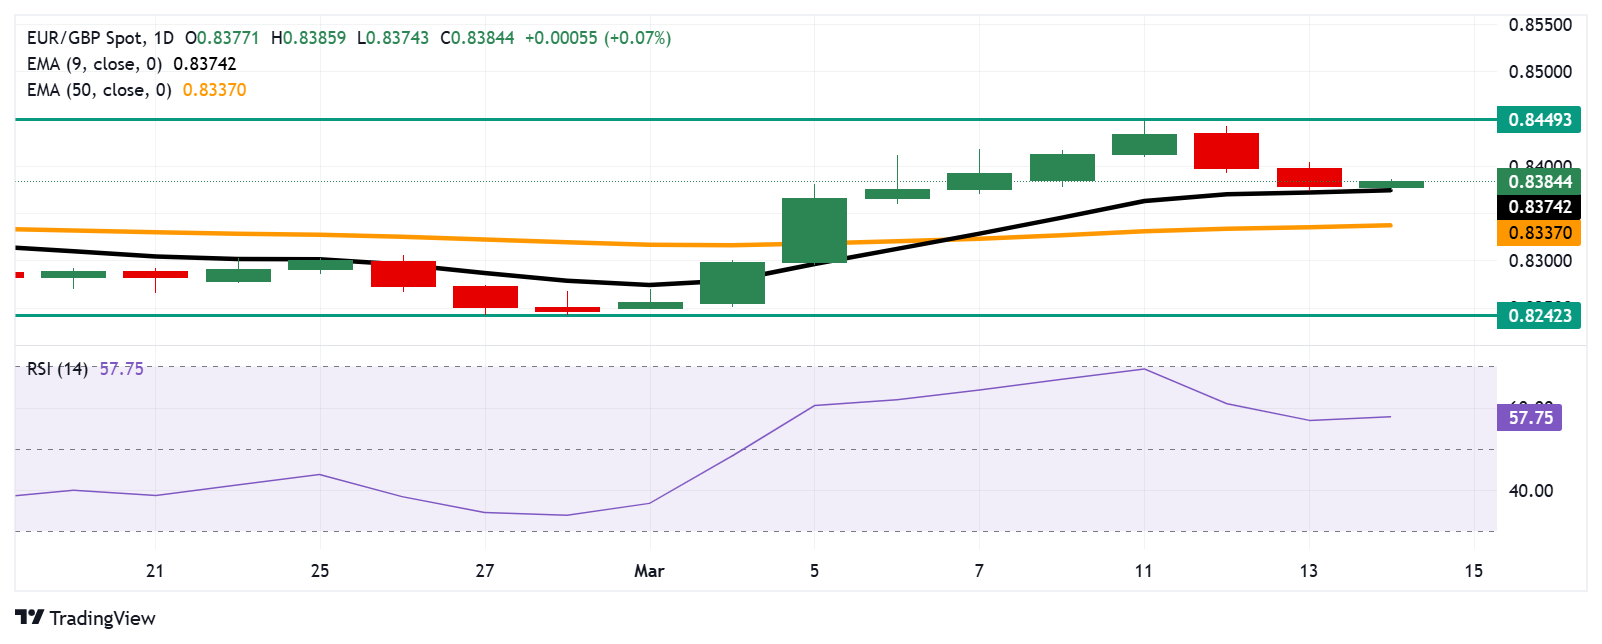
- EUR/GBP could find primary resistance around the psychological level of 0.8400.
- The currency cross is testing nine-day EMA support, suggesting a potential weakening of short-term price momentum.
- UK Gross Domestic Product declined by 0.1% following a 0.4% increase in December.
EUR/GBP gains ground after registering losses in the previous two sessions, trading around 0.8380 during the early European hours. The currency cross appreciates following the United Kingdom’s (UK) Gross Domestic Product (GDP) released on Friday.
The Office for National Statistics (ONS) reported that the UK economy shrank in January, with Gross Domestic Product (GDP) declining by 0.1% following a 0.4% increase in December. Markets had anticipated a 0.1% expansion for the period.
A technical examination of the daily chart indicates the price of the currency cross testing nine-day Exponential Moving Average (EMA) support, suggesting a potential weakening of short-term price momentum.
However, the 14-day Relative Strength Index (RSI), a key momentum indicator, remains above 50, indicating a bullish bias is still intact. However, the EUR/GBP cross remains above the 50-day, reinforcing medium-term price momentum.
On the upside, the EUR/GBP cross could explore the area around the psychological level of 0.8400, followed by the two-month high of 0.8449, met on March 11.
The EUR/GBP cross tests immediate support at the nine-day EMA of 0.8374 level, followed by the 50-day EMA at 0.8337 level. A break below this level could weaken the medium-term price momentum and lead the currency cross to navigate the region around the three-month low at 0.8242 level, recorded on February 28.
EUR/GBP: Daily Chart
Economic Indicator
Gross Domestic Product (MoM)
The Gross Domestic Product (GDP), released by the Office for National Statistics on a monthly and quarterly basis, is a measure of the total value of all goods and services produced in the UK during a given period. The GDP is considered as the main measure of UK economic activity. The MoM reading compares economic activity in the reference month to the previous month. Generally, a rise in this indicator is bullish for the Pound Sterling (GBP), while a low reading is seen as bearish.
Read more.