- Australian Dollar gains ground on encouraging Chinese PMI data.
- RBA Meeting Minutes will be awaited to be released on Tuesday.
- Chinese Manufacturing PMI came in at 51.1, against the expected 51.0 and 50.9 prior.
- US Dollar faces challenges after dovish remarks from Fed Chair Powell.
The Australian Dollar (AUD) retraces its recent losses on Monday, possibly bolstered by positive Chinese Purchasing Managers Index (PMI) figures. Moreover, the US Dollar (USD) faced downward pressure due to decreased US Treasury yields, lending support to the AUD/USD pair. Trading activity is anticipated to be subdued due to Easter Monday.
The Australian Dollar encountered challenges amidst weaker Consumer Inflation Expectations, possibly signaling expectations for interest rate cuts by the Reserve Bank of Australia (RBA) in late 2024. Investors are likely to closely monitor the release of the RBA Meeting Minutes scheduled for Tuesday.
The US Dollar Index (DXY) struggled on dovish remarks from the Federal Reserve (Fed) Chairman Jerome Powell on Friday. He stated that the recent US inflation data aligned with the desired trajectory, affirming the Federal Reserve’s stance on interest rate cuts for the year. Personal Consumption Expenditures Price Index (PCE) data from the United States (US) met expectations in February.
Daily Digest Market Movers: Australian Dollar increases on positive Chinese PMI figures
- Australia’s Consumer Inflation Expectations came in at 4.3% in March, a slight decrease from the previous increase of 4.5%.
- On Sunday, China’s National Bureau of Statistics (NBS) announced that the monthly NBS Manufacturing PMI rose to 50.8 in March from 49.1 in the prior month. Additionally, the NBS Non-Manufacturing PMI increased to 53.0 in March from 51.4 in February.
- On Thursday, San Francisco Federal Reserve (Fed) President Mary C. Daly emphasized that although the Fed stands prepared to decrease rates when data supports such action, there’s no need for haste as the US economy remains robust with minimal risk of weakening.
- Federal Reserve Board Governor Christopher Waller still sees ‘no rush’ to cut rates amid sticky inflation data.
- US Core PCE came at 0.3% (MoM) in February against January’s 0.5%, aligned with the market consensus. The annual index rose by 2.8% as expected, compared to the previous increase of 2.9%.
- US Headline PCE (MoM) increased by 0.3%, slightly lower than expected and a previous rise of 0.4%. The year-over-year PCE increased by 2.5%, as expected.
- US Gross Domestic Product Annualized expanded by 3.4% in the fourth quarter of 2023. The market expectation was to be unchanged at a 3.2% increase.
- The US Gross Domestic Product Price Index remained consistent at a 1.7% increase, as expected in Q4.
- Core Personal Consumption Expenditures (QoQ) came in at 2.0% in the fourth quarter, slightly below the expected and previous reading of 2.1%.
- US Initial Jobless Claims fell to 210K in the week ending on March 22, against the expected increase to 215K from 212K prior.
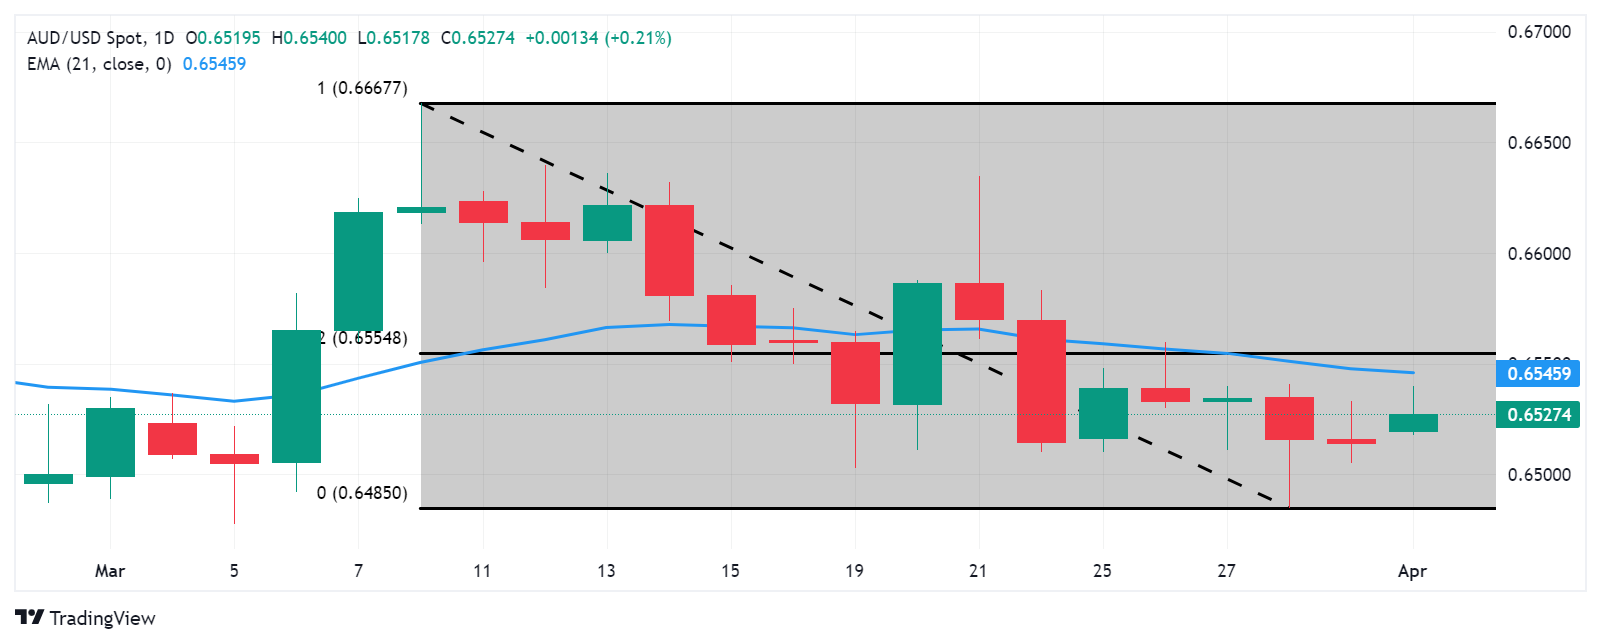
Technical Analysis: Australian Dollar rises to near 0.6530; next barrier at 21-day EMA
The Australian Dollar hovers near 0.6530 on Monday. Immediate resistance is observed near the 21-day Exponential Moving Average (EMA) at 0.6546, coinciding with a major barrier at 0.6550. A breach above this level could lead the AUD/USD pair to surpass the 38.2% Fibonacci retracement level of 0.6554, potentially leading towards the psychological level of 0.6600. On the downside, notable support lies at the psychological threshold of 0.6500, followed by March’s low at 0.6477.
AUD/USD: Daily Chart
Australian Dollar price today
The table below shows the percentage change of Australian Dollar (AUD) against listed major currencies today. Australian Dollar was the strongest against the New Zealand Dollar.
| USD | EUR | GBP | CAD | AUD | JPY | NZD | CHF | |
| USD | 0.02% | 0.02% | 0.02% | 0.09% | -0.03% | 0.05% | -0.03% | |
| EUR | -0.02% | 0.00% | 0.01% | 0.08% | -0.05% | 0.02% | -0.05% | |
| GBP | -0.02% | 0.00% | 0.00% | 0.08% | -0.06% | 0.03% | -0.06% | |
| CAD | -0.02% | 0.00% | -0.01% | 0.07% | -0.06% | 0.01% | -0.06% | |
| AUD | -0.09% | -0.07% | -0.08% | -0.08% | -0.13% | -0.06% | -0.12% | |
| JPY | 0.02% | 0.07% | 0.06% | 0.07% | 0.17% | 0.09% | 0.00% | |
| NZD | -0.05% | -0.02% | -0.02% | -0.01% | 0.05% | -0.08% | -0.08% | |
| CHF | 0.03% | 0.05% | 0.06% | 0.06% | 0.13% | 0.00% | 0.08% |
The heat map shows percentage changes of major currencies against each other. The base currency is picked from the left column, while the quote currency is picked from the top row. For example, if you pick the Euro from the left column and move along the horizontal line to the Japanese Yen, the percentage change displayed in the box will represent EUR (base)/JPY (quote).
Inflation FAQs
Inflation measures the rise in the price of a representative basket of goods and services. Headline inflation is usually expressed as a percentage change on a month-on-month (MoM) and year-on-year (YoY) basis. Core inflation excludes more volatile elements such as food and fuel which can fluctuate because of geopolitical and seasonal factors. Core inflation is the figure economists focus on and is the level targeted by central banks, which are mandated to keep inflation at a manageable level, usually around 2%.
The Consumer Price Index (CPI) measures the change in prices of a basket of goods and services over a period of time. It is usually expressed as a percentage change on a month-on-month (MoM) and year-on-year (YoY) basis. Core CPI is the figure targeted by central banks as it excludes volatile food and fuel inputs. When Core CPI rises above 2% it usually results in higher interest rates and vice versa when it falls below 2%. Since higher interest rates are positive for a currency, higher inflation usually results in a stronger currency. The opposite is true when inflation falls.
Although it may seem counter-intuitive, high inflation in a country pushes up the value of its currency and vice versa for lower inflation. This is because the central bank will normally raise interest rates to combat the higher inflation, which attracts more global capital inflows from investors looking for a lucrative place to park their money.
Formerly, Gold was the asset investors turned to in times of high inflation because it preserved its value, and whilst investors will often still buy Gold for its safe-haven properties in times of extreme market turmoil, this is not the case most of the time. This is because when inflation is high, central banks will put up interest rates to combat it. Higher interest rates are negative for Gold because they increase the opportunity cost of holding Gold vis-a-vis an interest-bearing asset or placing the money in a cash deposit account. On the flip side, lower inflation tends to be positive for Gold as it brings interest rates down, making the bright metal a more viable investment alternative.