


- The Australian Dollar strengthens amid rising commodity prices, including gold, steel, and iron ore.
- The AUD came under pressure following President Trump’s decision to maintain a 25% tariff on Australian aluminum and steel exports.
- The US Dollar strengthened as traders digested softer-than-expected Producer Price Index data released on Thursday.
The Australian Dollar (AUD) receives support from rising commodity prices, including Gold, Steel, and Iron Ore on Friday. However, The AUD/USD pair could face pressure from a strengthening US Dollar (USD) amid growing fears of a global economic slowdown.
A key challenge for the AUD comes from US President Donald Trump’s decision to uphold a 25% tariff on Australian aluminum and steel exports, valued at nearly $1 billion. This move adds strain to Australia’s trade outlook, impacting major exports.
Despite this, Australian Prime Minister Anthony Albanese confirmed that Australia will not impose reciprocal tariffs on the US, emphasizing that retaliatory measures would only raise costs for Australian consumers and fuel inflation.
Adding to market concerns, RBA Deputy Governor Andrew Hauser highlighted earlier that global trade uncertainty is at a 50-year high. Hauser warned that ongoing tariff policies and economic tensions could delay business investment and economic growth.
Meanwhile, reports from Bloomberg indicate that US-China trade negotiations remain deadlocked. Chinese officials claim that the US has not outlined clear steps regarding fentanyl-related measures required for tariff relief. Additionally, sources close to the White House reveal that there are currently no plans for an in-person meeting between US and Chinese leaders.
Australian Dollar could face challenges as global trade tensions weigh on market sentiment
- The US Dollar Index (DXY), which measures the USD against six major currencies, strengthened after positive jobless claims and softer-than-expected Producer Price Index (PPI) data released on Thursday. At the time of writing, the DXY is trading around 104.00 as markets shift focus to Friday’s Michigan Consumer Sentiment Index data.
- In the labor market, US Initial Jobless Claims came in at 220,000 for the week ending March 7, lower than expected 225,000. Continuing claims also fell to 1.87 million, below the forecast of 1.90 million, signaling resilience in the US job market.
- Meanwhile, inflationary pressures showed signs of easing. The US Producer Price Index (PPI) rose 3.2% year-over-year in February, down from 3.7% in January and below the 3.3% market expectation. The core PPI, which excludes food and energy, increased 3.4% annually, compared to 3.8% in January. On a monthly basis, the headline PPI remained unchanged, while the core PPI declined by 0.1%.
- With inflation cooling and labor market strength, traders and investors will closely monitor upcoming consumer confidence and inflation expectation data for further insights into the Federal Reserve’s monetary policy outlook and the USD’s future direction.
- The US Dollar faced challenges as the softer inflation report fueled speculation that the US Federal Reserve (Fed) could cut interest rates sooner than anticipated.
- US monthly headline inflation slowed to 0.2% in February, down from 0.5% in January, while core inflation eased to 0.2%, below the expected 0.3%. On an annual basis, headline inflation declined to 2.8% from 3.0%, while core inflation fell to 3.1% from 3.3%.
- President Trump threatened to impose a 200% tariff on all European wines and champagne via his social media account during Thursday’s early US session, raising widespread concerns in global markets.
- Senate Democratic Leader Chuck Schumer announced late Thursday that he will vote to keep the government open as the chamber prepares to consider a GOP stopgap funding bill on Friday.
- US Commerce Secretary Howard Lutnick said late Thursday that the administration aims to balance the budget during President Donald Trump’s term, targeting a three-year timeline to achieve it.
- Australia’s Consumer Inflation Expectations, consumer expectations of future inflation during the next 12 months, fell to 3.6% in March, down from 4.6% in February—the highest level since April 2024.
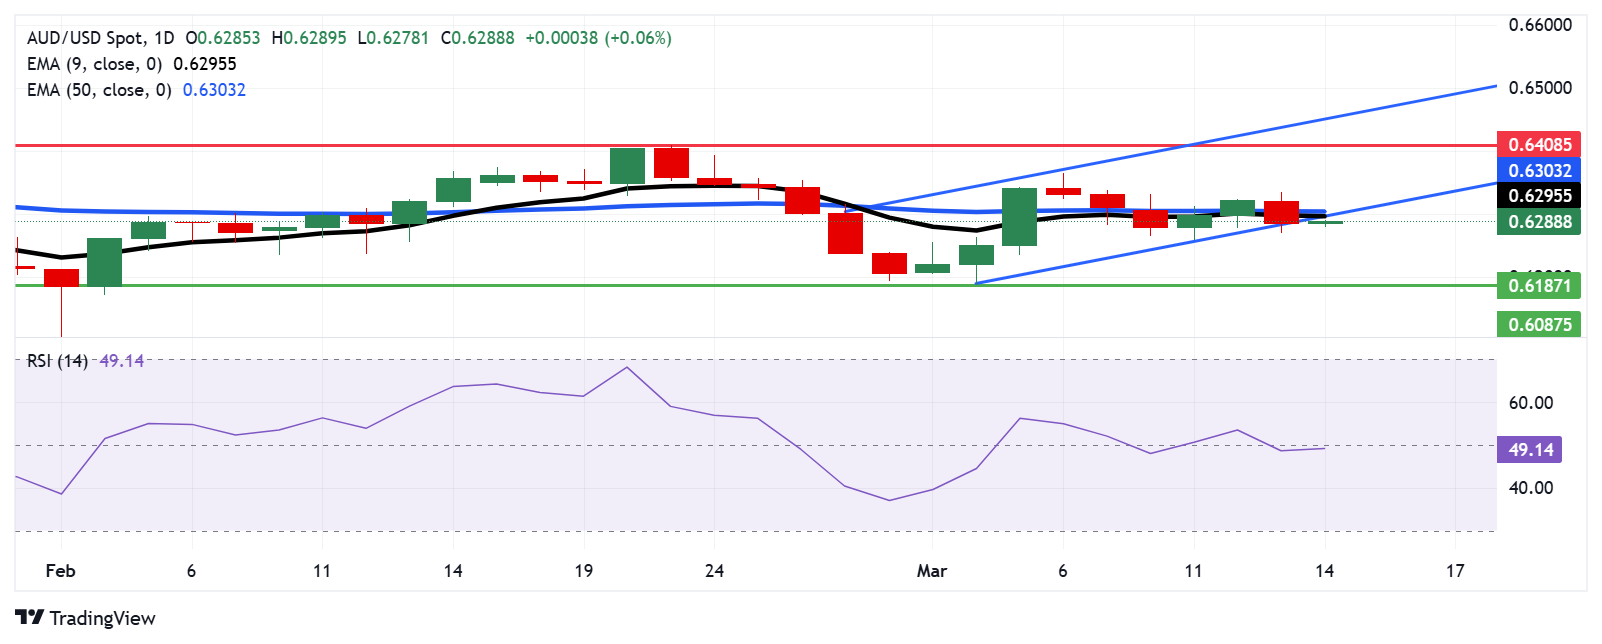
Technical Analysis: Australian Dollar breaks below 0.6300, ascending channel
AUD/USD is trading near 0.6290 on Friday, with technical analysis indicating a bearish shift after breaking below the ascending channel on the daily chart. Additionally, the 14-day Relative Strength Index (RSI) has dropped below 50, signaling the beginning of a bearish outlook.
On the downside, the AUD/USD pair could navigate the region around the five-week low of 0.6187, recorded on March 5.
The AUD/USD pair tests the immediate barrier at a nine-day Exponential Moving Average (EMA) of 0.6295, followed by a 50-day EMA at the 0.6303 level. A break above these levels could improve the short- and medium-price momentum and support the pair to explore the area around the three-month high of 0.6408, last reached on February 21.
AUD/USD: Daily Chart
Australian Dollar PRICE Today
The table below shows the percentage change of Australian Dollar (AUD) against listed major currencies today. Australian Dollar was the strongest against the Japanese Yen.
| USD | EUR | GBP | JPY | CAD | AUD | NZD | CHF | |
|---|---|---|---|---|---|---|---|---|
| USD | 0.11% | 0.07% | 0.45% | -0.03% | -0.11% | -0.20% | 0.10% | |
| EUR | -0.11% | -0.01% | 0.32% | -0.14% | -0.24% | -0.32% | 0.07% | |
| GBP | -0.07% | 0.01% | 0.33% | -0.14% | -0.22% | -0.30% | 0.09% | |
| JPY | -0.45% | -0.32% | -0.33% | -0.46% | -0.55% | -0.64% | -0.23% | |
| CAD | 0.03% | 0.14% | 0.14% | 0.46% | -0.07% | -0.17% | 0.23% | |
| AUD | 0.11% | 0.24% | 0.22% | 0.55% | 0.07% | -0.09% | 0.26% | |
| NZD | 0.20% | 0.32% | 0.30% | 0.64% | 0.17% | 0.09% | 0.40% | |
| CHF | -0.10% | -0.07% | -0.09% | 0.23% | -0.23% | -0.26% | -0.40% |
The heat map shows percentage changes of major currencies against each other. The base currency is picked from the left column, while the quote currency is picked from the top row. For example, if you pick the Australian Dollar from the left column and move along the horizontal line to the US Dollar, the percentage change displayed in the box will represent AUD (base)/USD (quote).
Economic Indicator
Michigan Consumer Sentiment Index
The Michigan Consumer Sentiment Index, released on a monthly basis by the University of Michigan, is a survey gauging sentiment among consumers in the United States. The questions cover three broad areas: personal finances, business conditions and buying conditions. The data shows a picture of whether or not consumers are willing to spend money, a key factor as consumer spending is a major driver of the US economy. The University of Michigan survey has proven to be an accurate indicator of the future course of the US economy. The survey publishes a preliminary, mid-month reading and a final print at the end of the month. Generally, a high reading is bullish for the US Dollar (USD), while a low reading is bearish.
Read more.
Next release: Fri Mar 14, 2025 14:00 (Prel)
Frequency: Monthly
Consensus: 63.1
Previous: 64.7
Source: University of Michigan