- The Australian Dollar gains ground as China’s Trade Surplus widens in October due to higher-than-expected Exports.
- Australia’s Trade Surplus fell to 4,609 million in September, against the expected 5,300 million.
- The US Federal Reserve is widely anticipated to lower its benchmark interest rate by 25 basis points on Thursday.
The Australian Dollar (AUD) appreciates following the release of China’s Trade Balance data on Thursday. However, the AUD received downward pressure against the US Dollar (USD) following the Aussie Trade Balance data earlier during the Asian hours. The downside risks for the AUD/USD pair seem possible as the US Dollar (USD) may appreciate further due to market optimism following the victory of former President Donald Trump in the US election.
China’s trade surplus expanded in October, reaching $95.27 billion year-over-year, surpassing the expected $75.1 billion and the previous $81.71 billion. Exports rose by 12.7% YoY, well above the anticipated 5.0% increase and the previous 2.4% growth. Meanwhile, annual imports fell by 2.3%, exceeding the expected 1.5% decline and contrasting with the previous 0.3% increase.
Australia’s trade surplus fell to 4,609 million in September, down from an expected 5,300 million and August’s figure of 5,284 million, as reported by the Australian Bureau of Statistics on Thursday. This was the smallest trade surplus since March, driven by a larger drop in exports compared to imports.
Traders anticipate the US Federal Reserve (Fed) will lower its benchmark interest rate by 25 basis points at its November meeting on Thursday. The CME FedWatch Tool indicates a 98.1% probability that the Fed will make this quarter-point rate cut in November, showing strong market consensus for a modest reduction this week.
Daily Digest Market Movers: Australian Dollar receives downward pressure from Trump’s victory
- Australia’s Exports fell by 4.3% in September from the 0.2% decline seen a month earlier. Meanwhile, Imports fell by 3.1% MoM in September, compared to a decrease of 0.2% seen in August.
- The US ISM Services Purchasing Managers’ Index increased to 56.0 in October, up from 54.9 in September, exceeding the forecast of 53.8. In contrast, the S&P Global Services PMI registered at 55.0 in October, slightly below the prior reading and the expected 55.3.
- The Reserve Bank of Australia (RBA) decided to hold the Official Cash Rate (OCR) steady at 4.35% on Tuesday, marking its eighth consecutive pause. RBA Governor Michele Bullock reiterated a hawkish stance, emphasizing the need for restrictive monetary policy given persistent inflation risks and a strong labor market.
- Australia’s Judo Bank Services PMI improved to 51.0 in October from 50.6 in the previous reading, above the market consensus of 50.6. The Composite PMI climbed to 50.2 in October versus 49.8 prior. Caixin China Services PMI also rose to 52.0 in October from 50.3 in September.
- The TD-MI Inflation Gauge rose by 0.3% month-over-month in October, up from a 0.1% increase in the prior month, marking the highest reading since July and ahead of the RBA’s November policy meeting. Annually, the gauge climbed by 3.0%, compared to the previous 2.6% reading.
- ANZ Australia Job Advertisements increased by 0.3% month-over-month in October, a notable slowdown from the upwardly revised 2.3% gain in September. Despite slower growth, this marks the second consecutive month of increases.
- China’s Commerce Minister Wang Wentao met with Australia’s Trade Minister Don Farrell on Sunday. China expressed hopes that Australia will continue enhancing its business environment and ensure fair and equitable treatment for Chinese companies.
Technical Analysis: Australian Dollar hovers below 0.6600, nine-day EMA
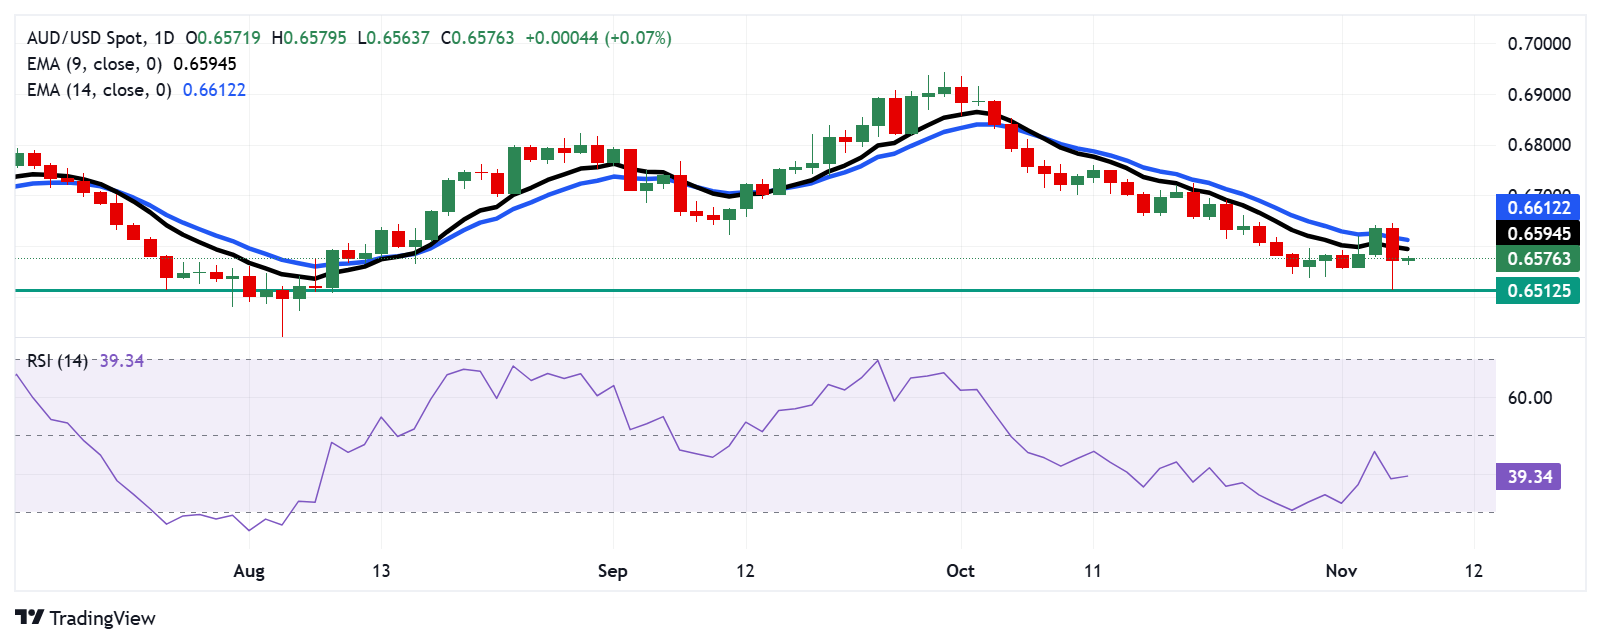
The AUD/USD pair trades around 0.6570 on Thursday. The daily chart technical indicators indicate a possible continuation of the bearish trend. The pair is positioned below the nine- and 14-day Exponential Moving Averages (EMAs), indicating downward momentum. The 14-day Relative Strength Index (RSI) also remains under 50, reinforcing a bearish outlook.
For the AUD/USD pair, immediate support is near the three-month low at 0.6512, followed by key psychological support at 0.6500.
On the upside, the AUD/USD pair may encounter resistance at the nine-day EMA of 0.6594, with further resistance at the 14-day EMA of 0.6612. A breakout above these levels could signal increasing momentum, potentially targeting the significant psychological level of 0.6700.
AUD/USD: Daily Chart

Australian Dollar PRICE Today
The table below shows the percentage change of Australian Dollar (AUD) against listed major currencies today. Australian Dollar was the strongest against the US Dollar.
| USD | EUR | GBP | JPY | CAD | AUD | NZD | CHF | |
|---|---|---|---|---|---|---|---|---|
| USD | -0.05% | -0.28% | -0.25% | -0.32% | -0.78% | -0.66% | -0.09% | |
| EUR | 0.05% | -0.24% | -0.17% | -0.27% | -0.73% | -0.61% | -0.04% | |
| GBP | 0.28% | 0.24% | 0.08% | -0.04% | -0.50% | -0.38% | 0.21% | |
| JPY | 0.25% | 0.17% | -0.08% | -0.10% | -0.56% | -0.49% | 0.14% | |
| CAD | 0.32% | 0.27% | 0.04% | 0.10% | -0.45% | -0.34% | 0.25% | |
| AUD | 0.78% | 0.73% | 0.50% | 0.56% | 0.45% | 0.12% | 0.74% | |
| NZD | 0.66% | 0.61% | 0.38% | 0.49% | 0.34% | -0.12% | 0.59% | |
| CHF | 0.09% | 0.04% | -0.21% | -0.14% | -0.25% | -0.74% | -0.59% |
The heat map shows percentage changes of major currencies against each other. The base currency is picked from the left column, while the quote currency is picked from the top row. For example, if you pick the Australian Dollar from the left column and move along the horizontal line to the US Dollar, the percentage change displayed in the box will represent AUD (base)/USD (quote).


