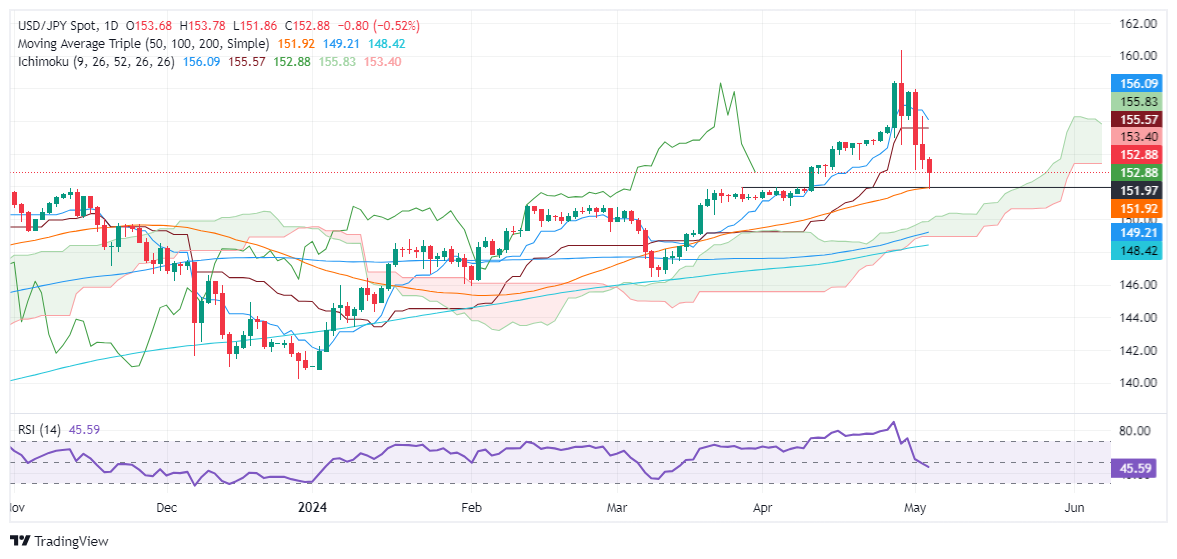
- USD/JPY drops 0.49%, extending a downtrend possibly sparked by earlier BoJ intervention.
- Bearish harami pattern observed; recovery contingent on breaking 153.00 resistance.
- Key support at 152.00; further declines may target April’s low of 150.81.
The USD/JPY dropped for the third straight day and accumulated losses of more than 3.40% in the week after a suspected intervention by the Bank of Japan (BoJ) on Monday. Since then, the pair formed a two-candlestick chart pattern, a ‘bearish harami’ which reassembles an inside day, confirmed by Wednesday’s price action. That said, on Friday, the pair fell 0.49% and traded at 152.93.
USD/JPY Price Analysis: Technical outlook
Despite retreating sharply during the week, the USD/JPY is still upward biased, as shown by the daily chart. The pair registered a daily low at the confluence of October 21, 2022, low and the 50-day moving average at around 151.87/92, but buyers lifted the pair toward current exchange rates.
If buyers push prices above 153.00 and achieve a daily close above the latter, that could pave the way for further gains. The first resistance would be the Senkou Span B at 153.35, followed by the 154.00 figure. Further gains are seen once those levels are surpassed, with the next resistance seen at the confluence of the Senkou Span A and the Kijun-Sen at 155.78.
On the other hand, the first support would be the 152.00 mark, followed by the previously mentioned confluence of the 50-DMA and October’s 2022 high at 151.92/87. A breach of that level would cause the pair to dive toward April’s 5 low at 150.81.
USD/JPY Price Action – Daily Chart


