


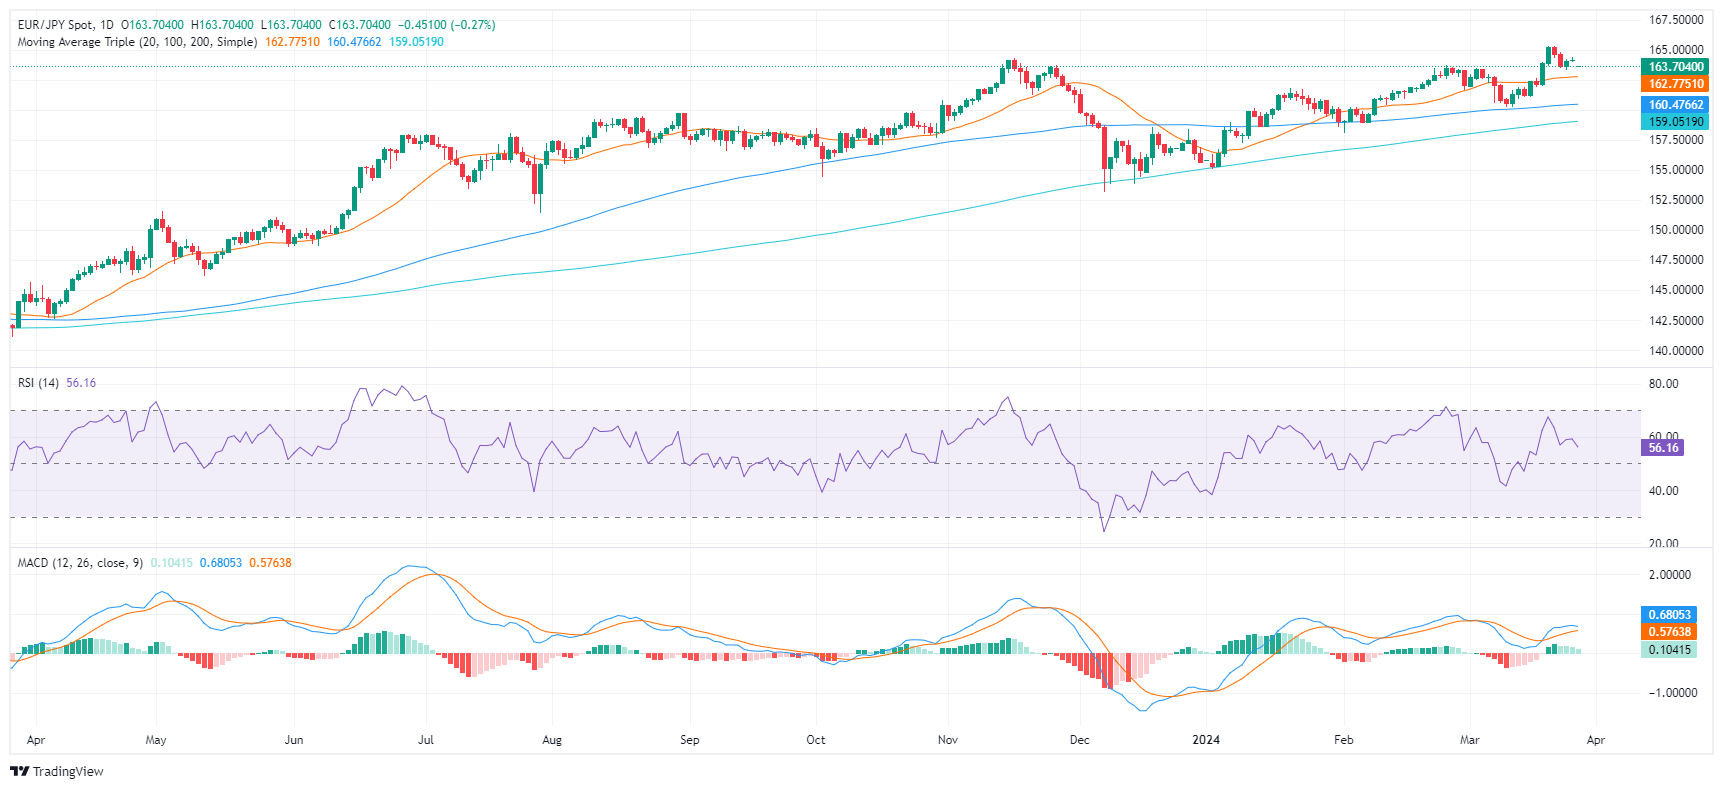
- Indicators on the daily chart signal a possible shift toward negative momentum.
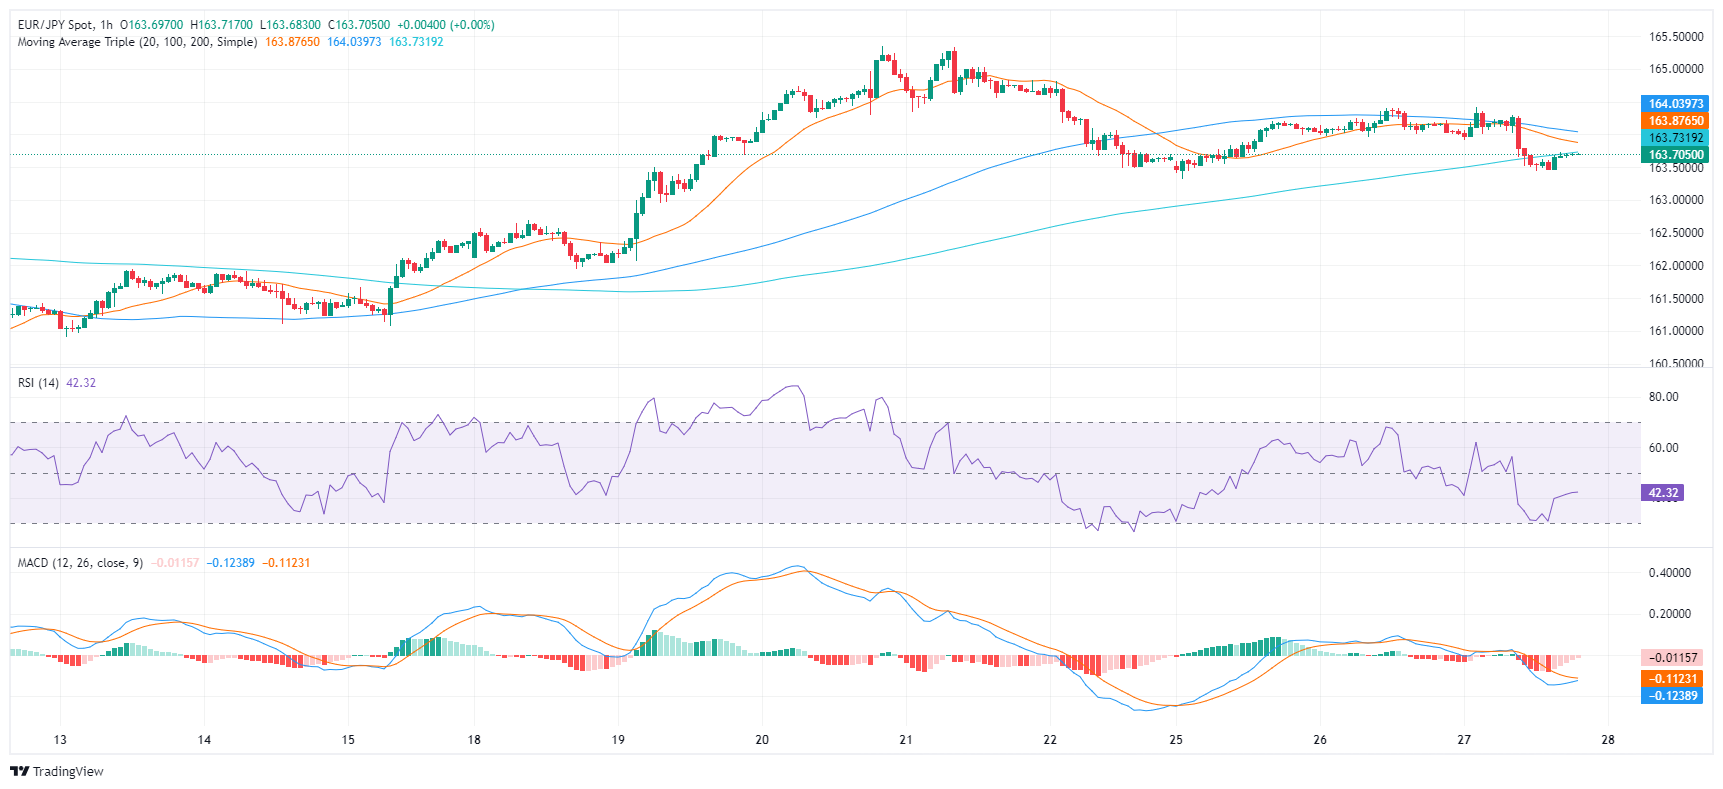
- The hourly chart shows RSI and MACD somewhat recovering in negative territory.
- Bulls need to maintain the 20-day SMA securely to fend off further dips.
In Wednesday’s session, EUR/JPY is trading with mild losses at 163.75. Despite uncertainties, the broader market sentiment appears to favor the buyers, given the pair’s dominant position above its key Simple Moving Averages (SMAs) of 20,100 and 200 days. However, the Relative Strength Index (RSI) and Moving Average Convergence Divergence (MACD) indicators signal an upcoming shift in momentum, hinting at increased strength in selling pressure.
On the daily chart indicators for the RSI remain in positive territory, with a downward trend which may signal a potential shift towards a negative trend. The MACD on the other hand, prints decreasing green bars, further reinforcing the weakened bullish momentum.
EUR/JPY daily chart
Regarding the hourly chart, the RSI values display a positive slope, signaling increased buying momentum. The lowest peak at 31 clearly shows that market sentiment has shifted to a bearish stance on Wednesday but in the meantime, indicators seem to be consolidating. Furthermore, the MACD) histogram’s red bars confirm the presence of negative momentum.
EUR/JPY hourly chart