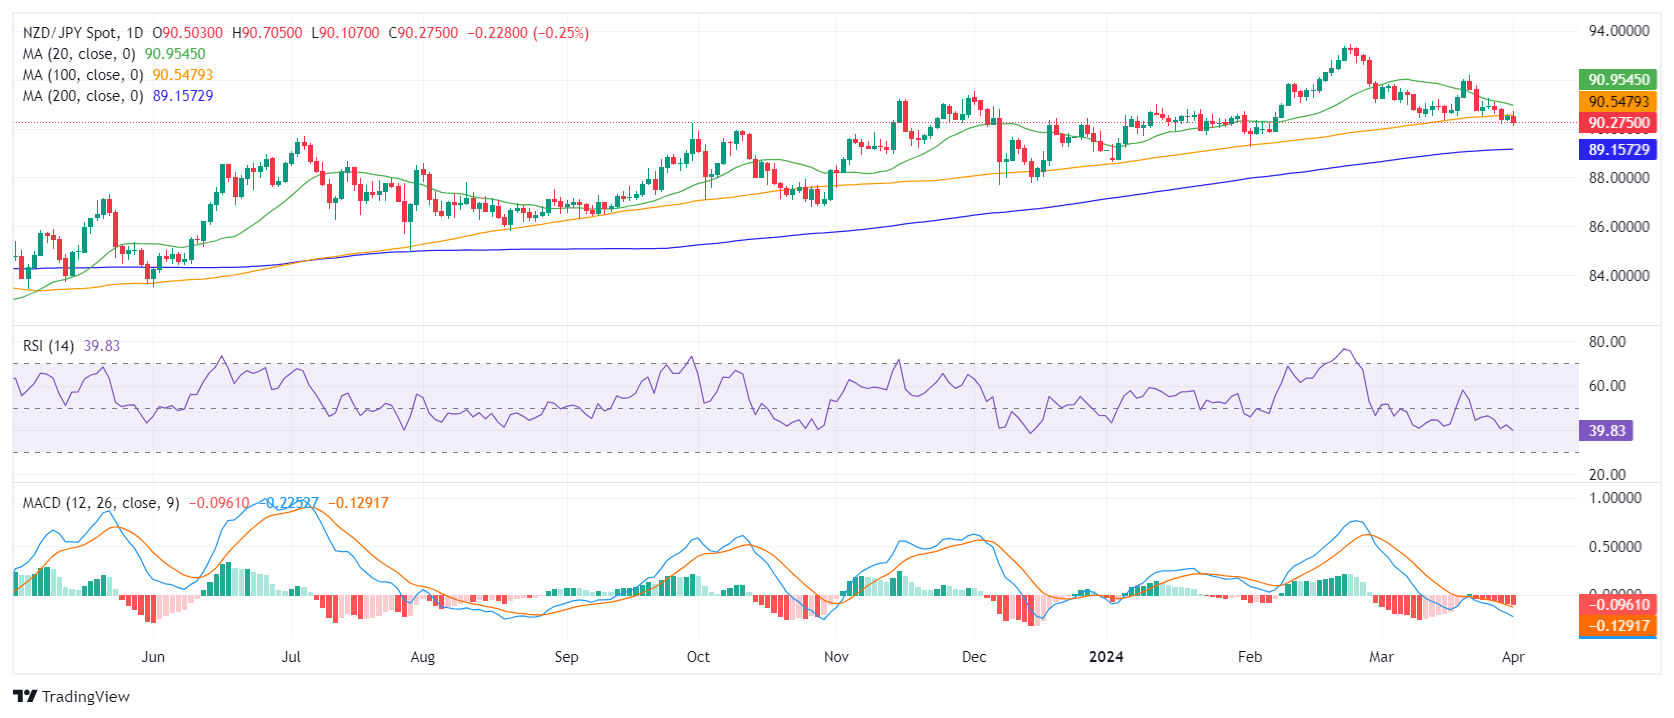
- The RSI on the daily chart lies deep in negative terrain.
- Inidicators on the hourly chart are showing a slight improvement.
- The 20 and 100-day SMAs are about to complete a bearish crossover around 91.00.
In Tuesday’s session, the NZD/JPY pair is trading with a slight rise to 90.42, marking a 0.16% gain. Despite this, sellers retain dominance within the broader market scenario, hinting towards an entrenched bearish sentiment. Encouragingly though, hourly data suggests the potential for short-term bullish corrections, indicating a touch of buyer resilience.
On the daily chart, the Relative Strength Index (RSI) shows a predominantly negative trend, remaining in the negative territory in the last sessions. Concurrently, the Moving Average Convergence Divergence (MACD) histogram reveals rising red bars, indicating a rising negative momentum.
NZD/JPY daily chart

Moving on to the hourly chart, RSI values are inclining more towards the positive side, with the recent readings registered at 53. This shift may hint at a short-term gain in buyers’ momentum. In addition, the hourly MACD histogram displays green bars, adding arguments for the recovering bullish momentum.
NZD/JPY hourly chart

Upon examining the broader perspective, the NZD/JPY has showcased significant bearish tendencies as its sits below its 20, 100 and 200-day Simple Moving Averages (SMA). In addition, a bearish crossover of the 20 and 100-day SMA at around 91.00 could precipitate even sharper declines.
Summarizing, sellers seem to have control over the NZD/JPY pair’s direction on the daily chart. However, recent hourly data indicates potential short-term bullish corrections. Nevertheless, the prevailing trend is inclined towards further weakness, reinforced by the SMA positioning, and a potential bearish crossover.


