- Bitcoin’s price hovers around $76,200 on Wednesday after falling 3.59% the previous day.
- Ethereum price continues to show weakness, reaching levels below $1,400.
- XRP breaks below its support level of $1.96, hinting at a correction ahead.
Bitcoin (BTC) price hovers around $76,200 on Wednesday after falling 3.59% the previous day. Ethereum (ETH) and Ripple (XRP) followed BTC’s footsteps and continued their downward trend. The technical outlook suggests a correction, targeting $73,000 BTC, $1,300 ETH, and $1.30 XRP.
Bitcoin bears gain momentum, targeting the $73,000 mark
Bitcoin price was rejected from its resistance of $85,000 on April 2 and declined 10.55% until Tuesday. It reached a yearly low of $74,508 on Monday. At the time of writing on Wednesday, it hovers around $76,000.
If BTC continues its downward trend, it could extend the decline to test its next daily support level at $73,072.
The daily chart’s Relative Strength Index (RSI) is around 33, indicating strong bearish momentum and backs the negative outlook.
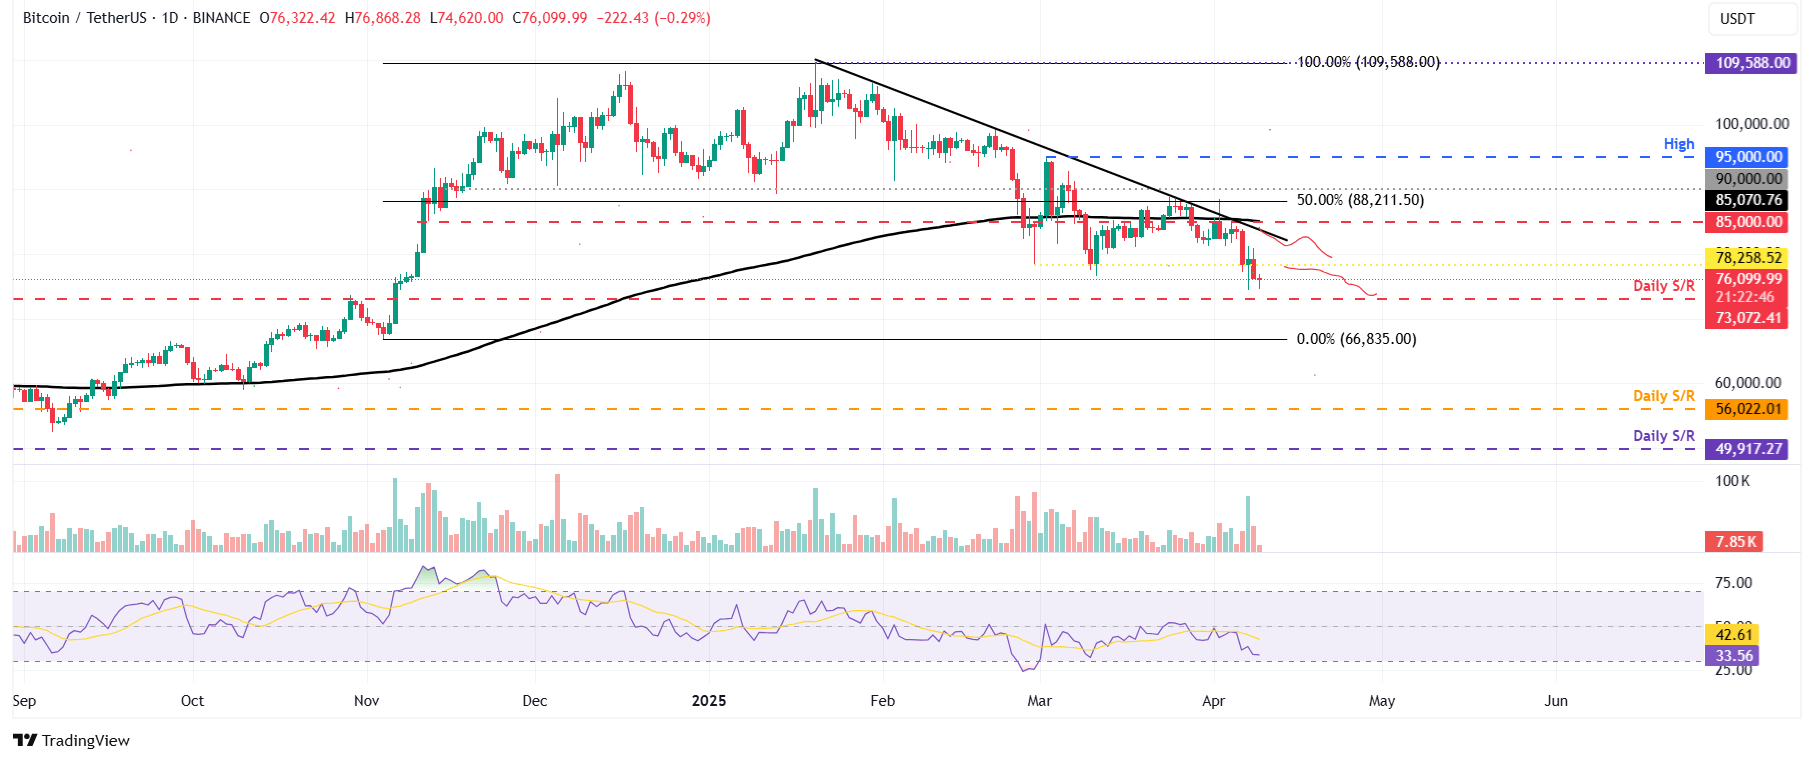
BTC/USDT daily chart
However, if BTC recovers and closes above its daily resistance at $85,000, it could extend the recovery rally to the key psychological level of $90,000.
Ethereum continues its downward momentum, aiming for the $1,300 level
Ethereum price declined nearly 13% last week after failing to close above the daily level of $1,861. As of this week, it continues its downward momentum and declined nearly 7% until Tuesday. At the time of writing on Wednesday, it falls below its daily support level of $1,449, reaching levels not seen since October 2023.
If ETH closes below its daily support level of $1,449, it could extend the decline to retest its important psychological level of $1,300.
The RSI reads 23, below its oversold level of 30, indicating that Ethereum may be undervalued and could be due for a price recovery to the upside. However, the RSI could remain below the oversold level and continue its downward spiral.
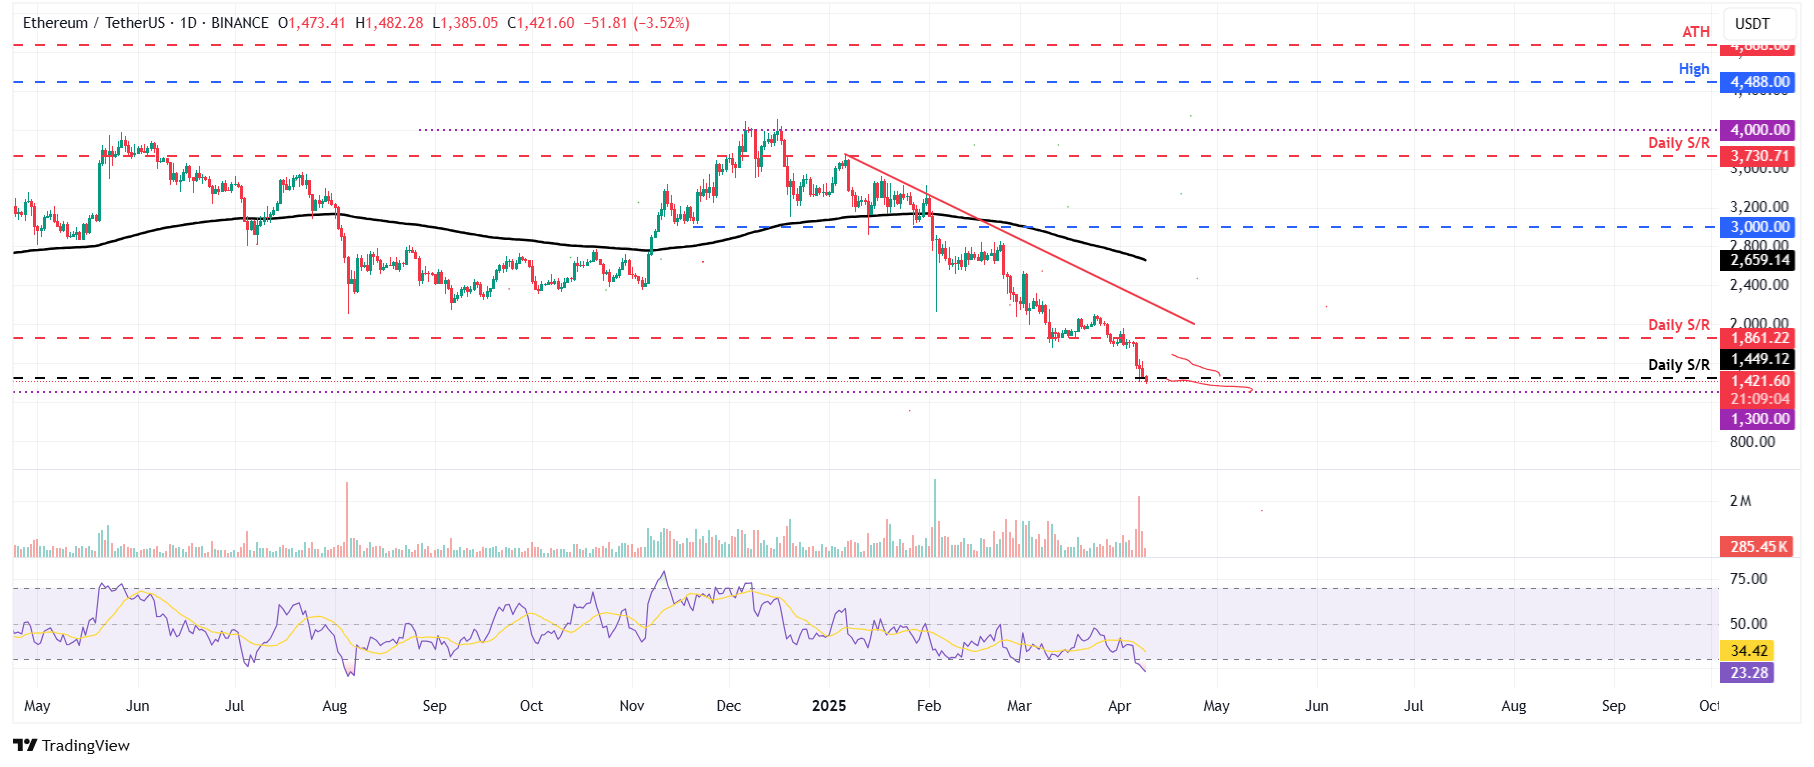
ETH/USDT daily chart
Conversely, if ETH recovers, it could extend the recovery to retest its important psychological level of $1,700.
XRP bears aim for the $1.30 mark
XRP price was rejected from its 200-day Exponential Moving Average (EMA) at $1.94 on Monday and declined by 6.5% until the next day. Moreover, XRP reached a new yearly low of $1.61 earlier this week. At the time of writing on Wednesday, it hovers around the $1.77 level.
If XRP continues its downward trend and closes below the $1.77 level, it could extend the decline to test its new yearly low of $1.61. A successful close below this level could extend an additional decline to retest its weekly support level at $1.30.
The RSI on the daily chart reads 30, approaching its oversold level of 30, indicating strong bearish momentum and supporting the negative outlook. Moreover, if the RSI slips below its oversold level, XRP may be undervalued and could be due for a price recovery to the upside. However, the RSI could remain below the oversold level and continue its downward spiral.
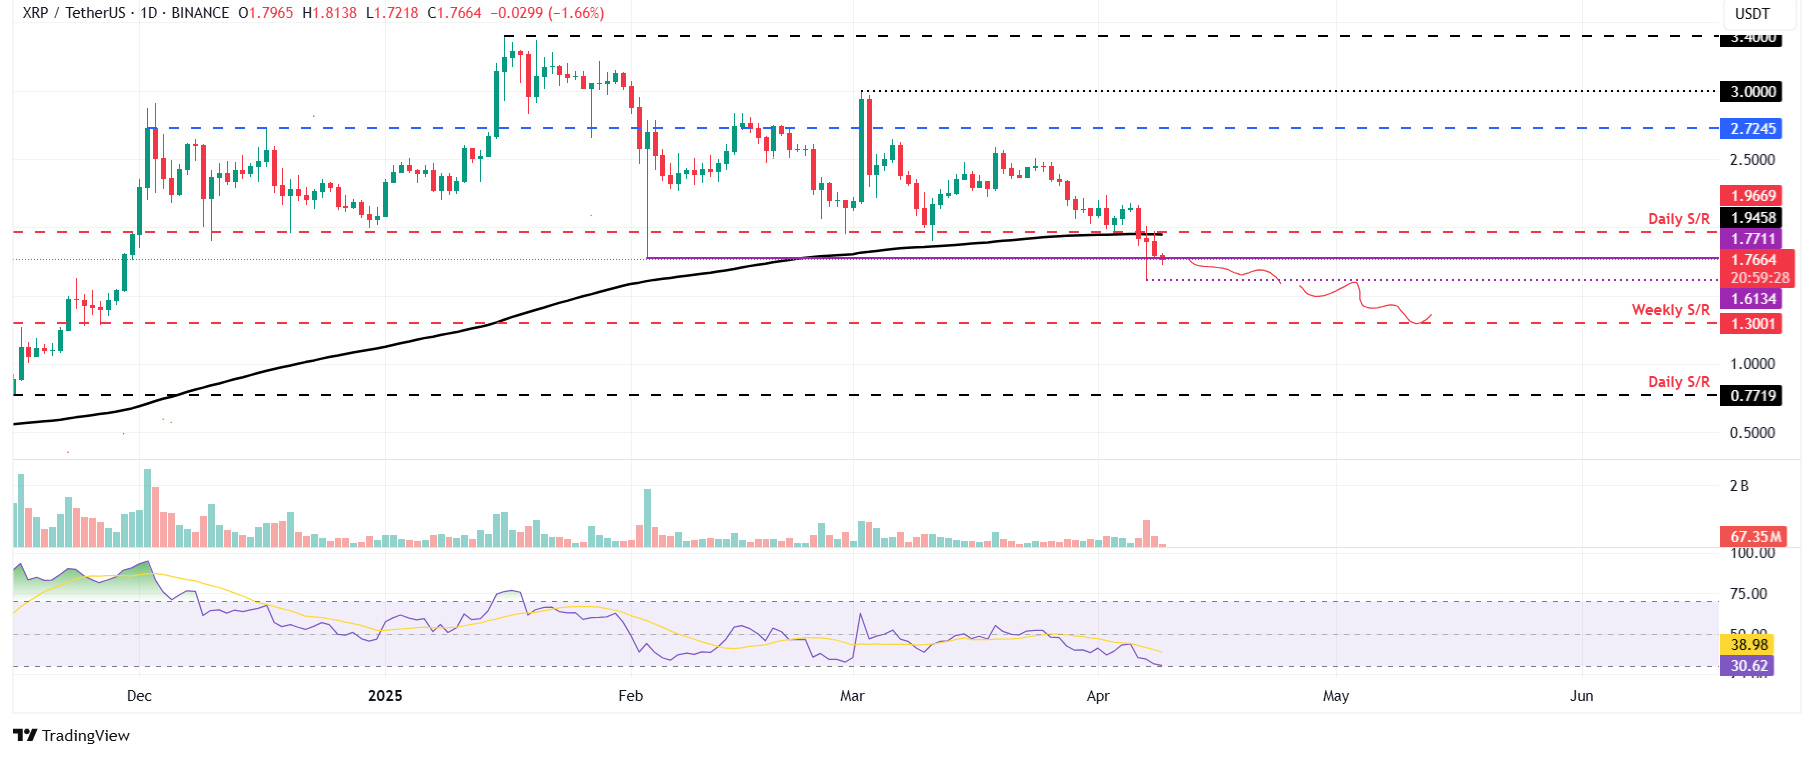
XRP/USDT daily chart
On the other hand, if XRP recovers, it could extend the recovery to test its daily level at $1.96.
Bitcoin, altcoins, stablecoins FAQs
Bitcoin is the largest cryptocurrency by market capitalization, a virtual currency designed to serve as money. This form of payment cannot be controlled by any one person, group, or entity, which eliminates the need for third-party participation during financial transactions.
Altcoins are any cryptocurrency apart from Bitcoin, but some also regard Ethereum as a non-altcoin because it is from these two cryptocurrencies that forking happens. If this is true, then Litecoin is the first altcoin, forked from the Bitcoin protocol and, therefore, an “improved” version of it.
Stablecoins are cryptocurrencies designed to have a stable price, with their value backed by a reserve of the asset it represents. To achieve this, the value of any one stablecoin is pegged to a commodity or financial instrument, such as the US Dollar (USD), with its supply regulated by an algorithm or demand. The main goal of stablecoins is to provide an on/off-ramp for investors willing to trade and invest in cryptocurrencies. Stablecoins also allow investors to store value since cryptocurrencies, in general, are subject to volatility.
Bitcoin dominance is the ratio of Bitcoin’s market capitalization to the total market capitalization of all cryptocurrencies combined. It provides a clear picture of Bitcoin’s interest among investors. A high BTC dominance typically happens before and during a bull run, in which investors resort to investing in relatively stable and high market capitalization cryptocurrency like Bitcoin. A drop in BTC dominance usually means that investors are moving their capital and/or profits to altcoins in a quest for higher returns, which usually triggers an explosion of altcoin rallies.