- Bitcoin price approaches the $56,022 support level; if the level holds, it could continue its recovery.
- Ethereum price faces resistance around the $2,421 level, and a close below the level could prolong its downtrend.
- Ripple price faces rejection around the 200-day EMA at $0.548, eyeing a decline ahead.
Bitcoin (BTC) price approaches a critical support level; if it holds, it might pave the way for further recovery. However, Ethereum (ETH) and Ripple (XRP) find rejection around their resistance level and could be poised for declines, diverging from BTC’s potential rebound.
Bitcoin price could continue its recovery if it finds support around $56,000 level
Bitcoin price retested and found support around the $54,000 level on Saturday, bouncing 6% over the next three days. It broke and closed above the $56,022 daily resistance level on Monday. At the time of writing on Wednesday, it trades slightly down by 1% at $57,038.
If the $56,022 continues to hold as support, BTC could rise 6% to retest its 50% price retracement level at $59,529 (drawn from a high in late July to a low in early August).
The Relative Strength Index (RSI) on the daily chart is hovering around its neutral level of 50, indicating indecisiveness among investors. The Awesome Oscillator (AO) still trades well below its neutral level of zero. Both indicators should trade above their respective neutral levels for any upcoming recovery rally to be sustained.
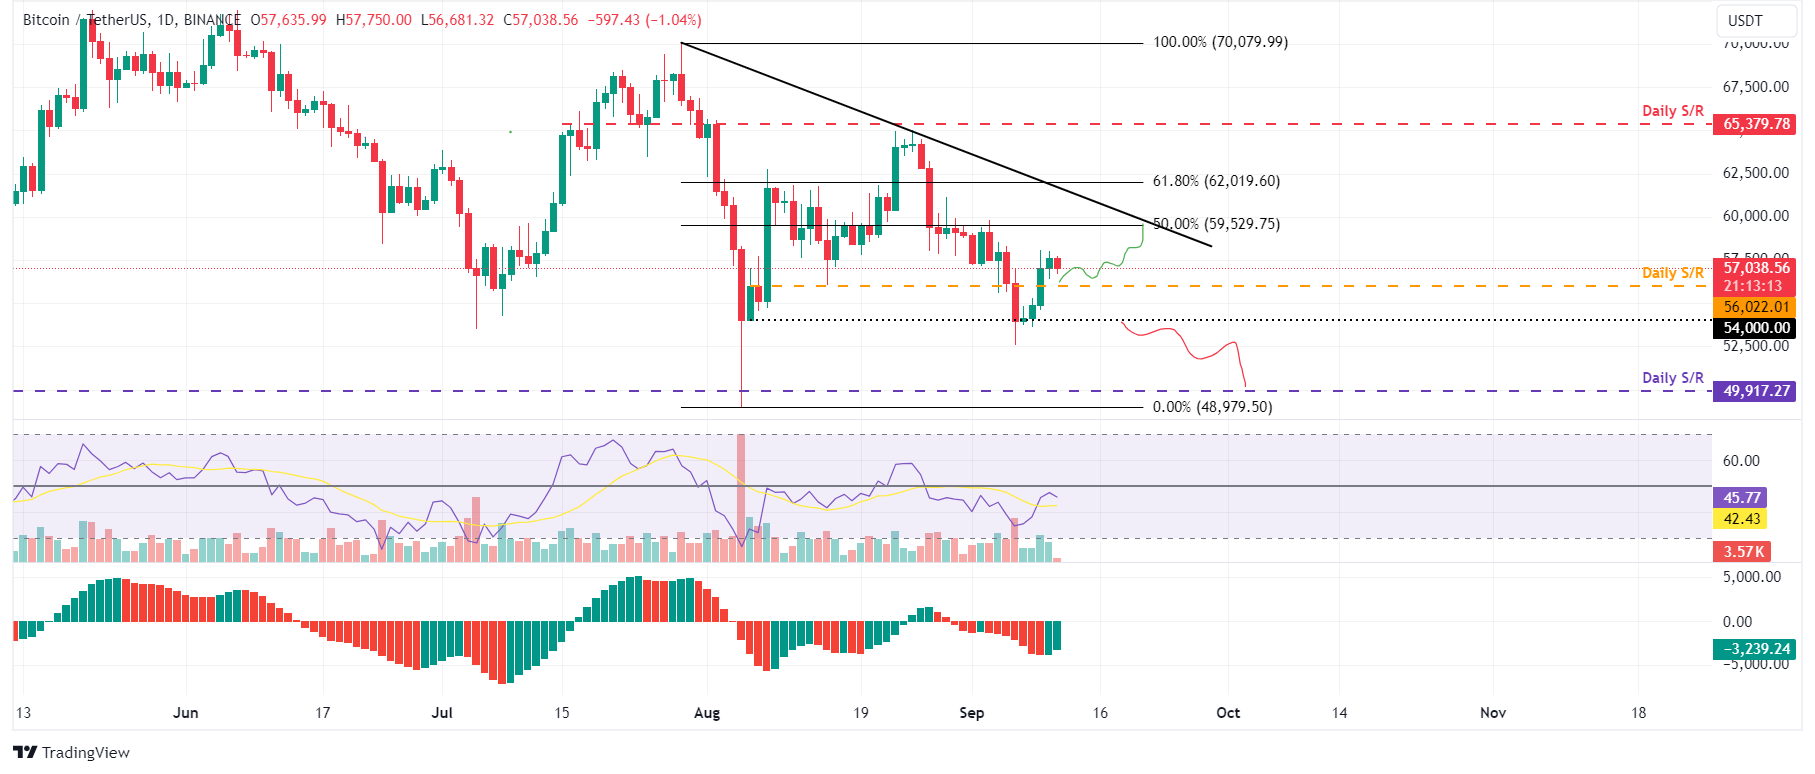
BTC/USDT daily chart
This bullish thesis will be invalidated if Bitcoin price closes below the $54,000 support level. In this scenario, BTC could decline by an additional 7% and retest the next daily support at $49,917.
Ethereum price is set for a decline as it nears its daily resistance level
Ethereum price faces rejection around the daily resistance at $2,421 after recovering 7.5% in the last four days. At the time of writing on Wednesday, it trades slightly lower by 1.6% at $2,349.
If ETH continues to face resistance from the $2,421 level, it could decline 5.5% from its current trading level to retest its September 7 low of $2,225.
The RSI and AO are trading below the neutral levels of 50 and zero on the daily chart. These momentum indicators signal a continuation of the bearish dominance and impending fall in prices on the horizon.
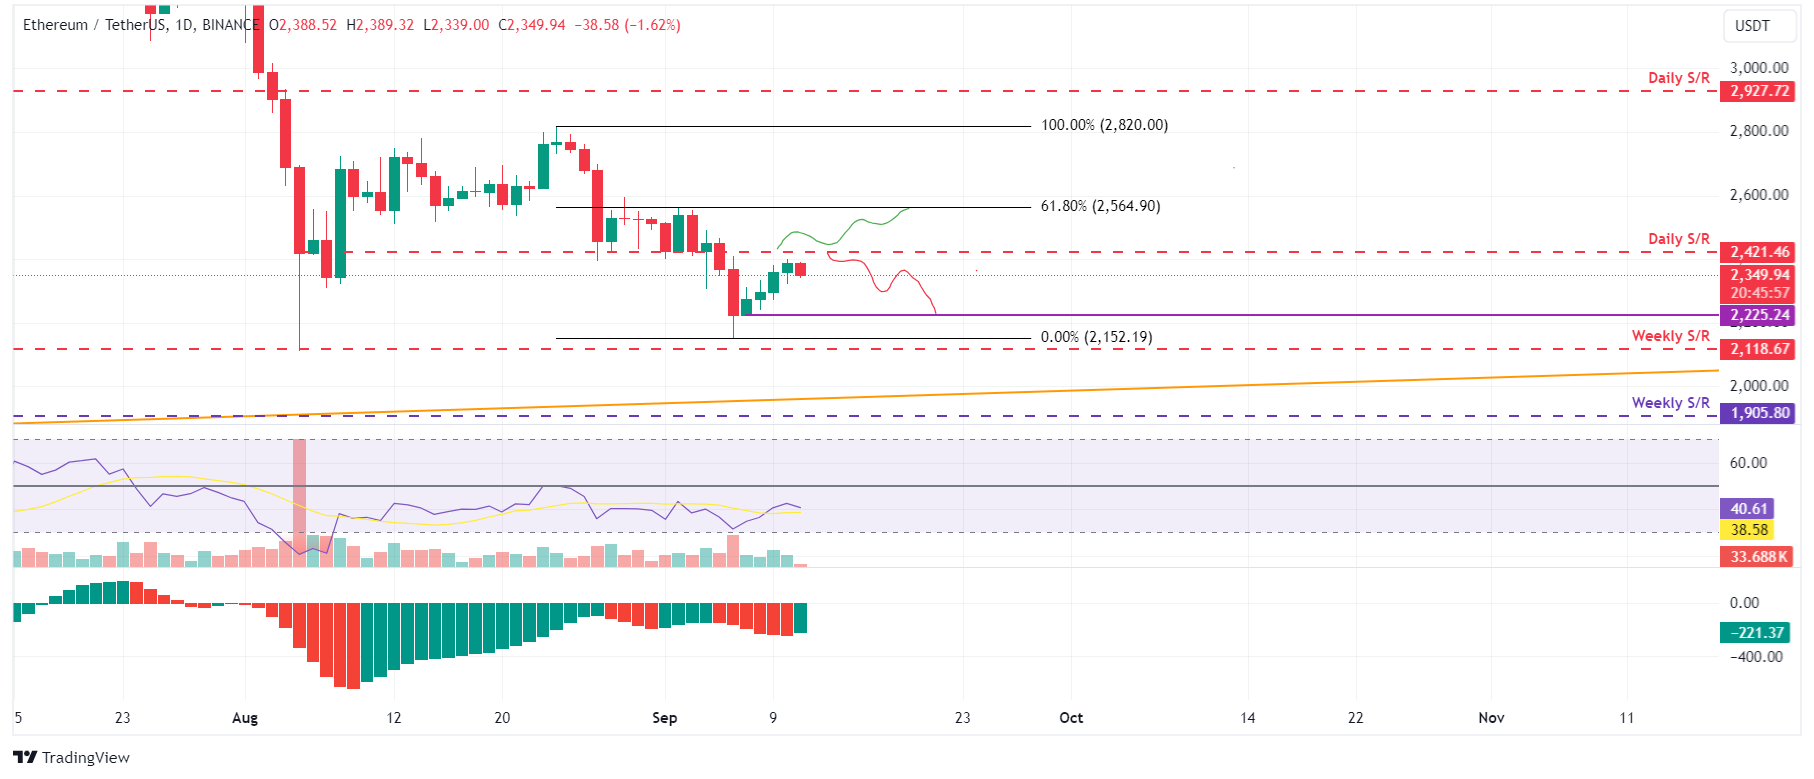
ETH/USDT daily chart
On the other hand, if ETH breaks and closes above the $2,421 level, this would invalidate the bearish thesis, and it could rally 5.8% to retest its 61.8% Fibonacci retracement level at $2,564.
Ripple price is at risk of downfall as it finds rejection around 200-day EMA
Ripple price finds rejection around the 200-day Exponential Moving Average (EMA), hovering around $0.548 and the daily support level at $0.544 on Tuesday. As of Wednesday, it trades slightly down by 1.37% at $0.533.
If the 200-day EMA at $0.548 continues to hold as resistance, it could decline 6% to retest its September 6 low of $0.502.
The daily chart’s RSI and AO are trading below the neutral levels of 50 and zero. These momentum indicators strongly indicate bearish dominance.
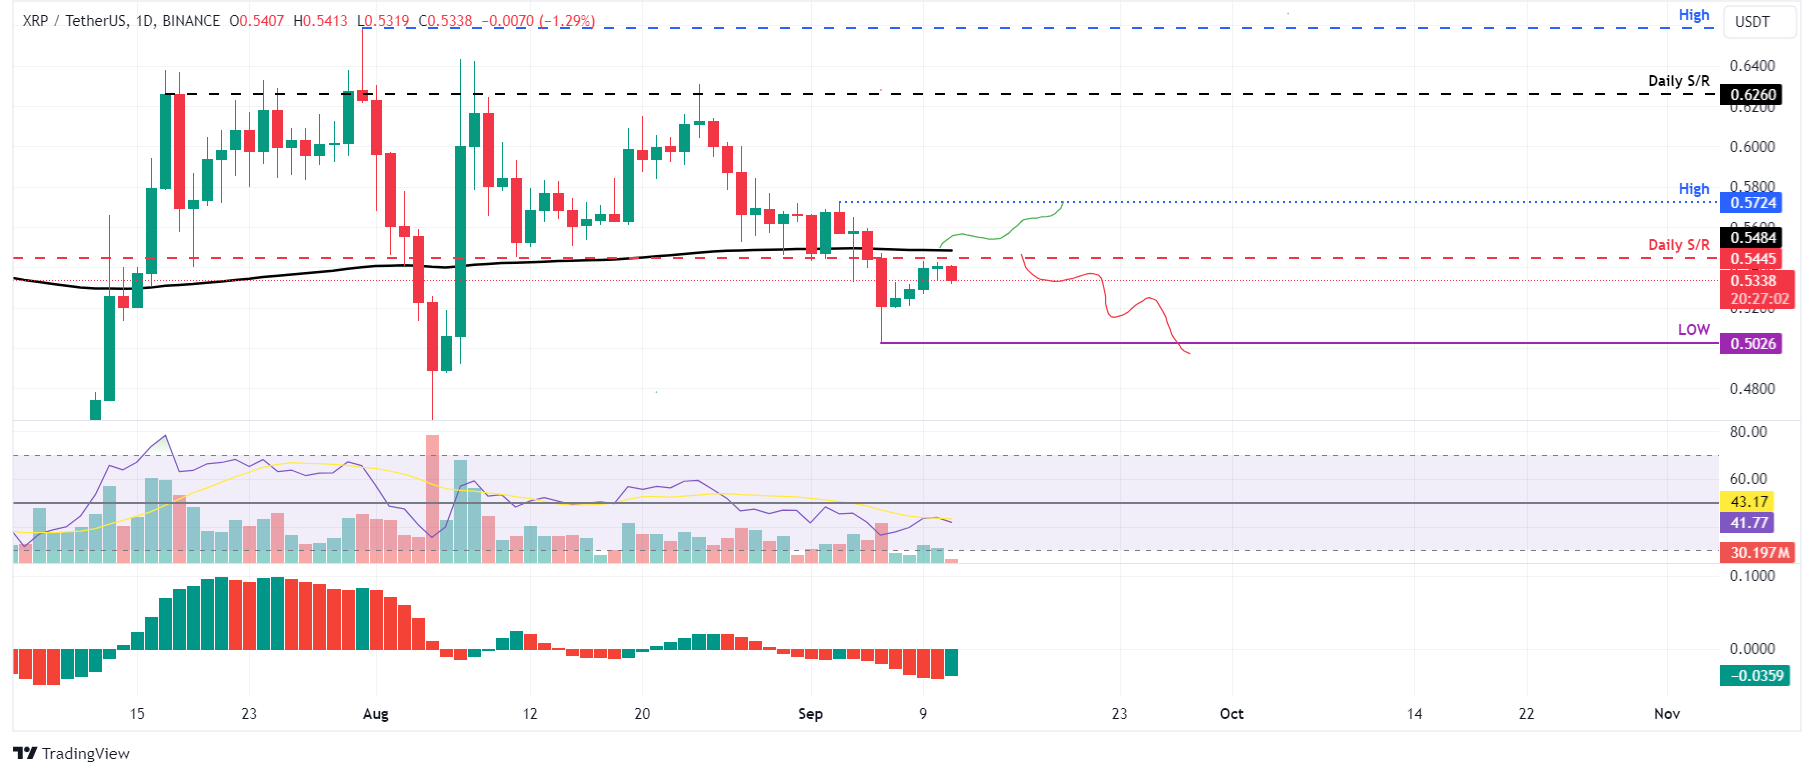
XRP/USDT daily chart
However, if the Ripple price breaks above the $0.544 daily resistance level and closes above the 200-day EMA at $0.548. This would invalidate the bearish thesis, and it could rise 4% to revisit the September 3 high of $0.572.