


- Bitcoin records a new all-time high, surpassing $121K, with bulls targeting $126K.
- Ethereum edges higher above $3,000, supported by a golden cross, increasing the chances of further gains.
- Ripple’s XRP extends Sunday’s gains for a bullish start to the week, inching closer to the $3 mark.
Bitcoin (BTC) extends the gains from Sunday, printing a record high of $121,492 at press time on Monday. Ethereum (ETH) exceeds the $3,000 mark while Ripple (XRP) advances on a bullish route, inching closer to the $3 mark. With the rising bullish momentum, traders anticipate an extended rally among the top 3 cryptocurrencies.
Bitcoin hits a new all-time high, targets $126K
Bitcoin edges higher by nearly 2% at press time on Monday, entering the uncharted levels above $121K. The BTC rally challenges the 61.8% trend-based Fibonacci retracement level at $121,357 drawn from the April 7 low of $74,508 to the high of May 22 at $111,980.
With Bitcoin entering the price discovery mode, a daily close above $121,357 could extend the uptrend to the 78.6% Fibonacci level at $127,652.
The Relative Strength Index (RSI) reads 77 on the daily chart, highlighting Bitcoin as overbought. Further, the Moving Average Convergence/Divergence (MACD) indicator displays rising green histogram bars from the zero line, suggesting increased bullish momentum.
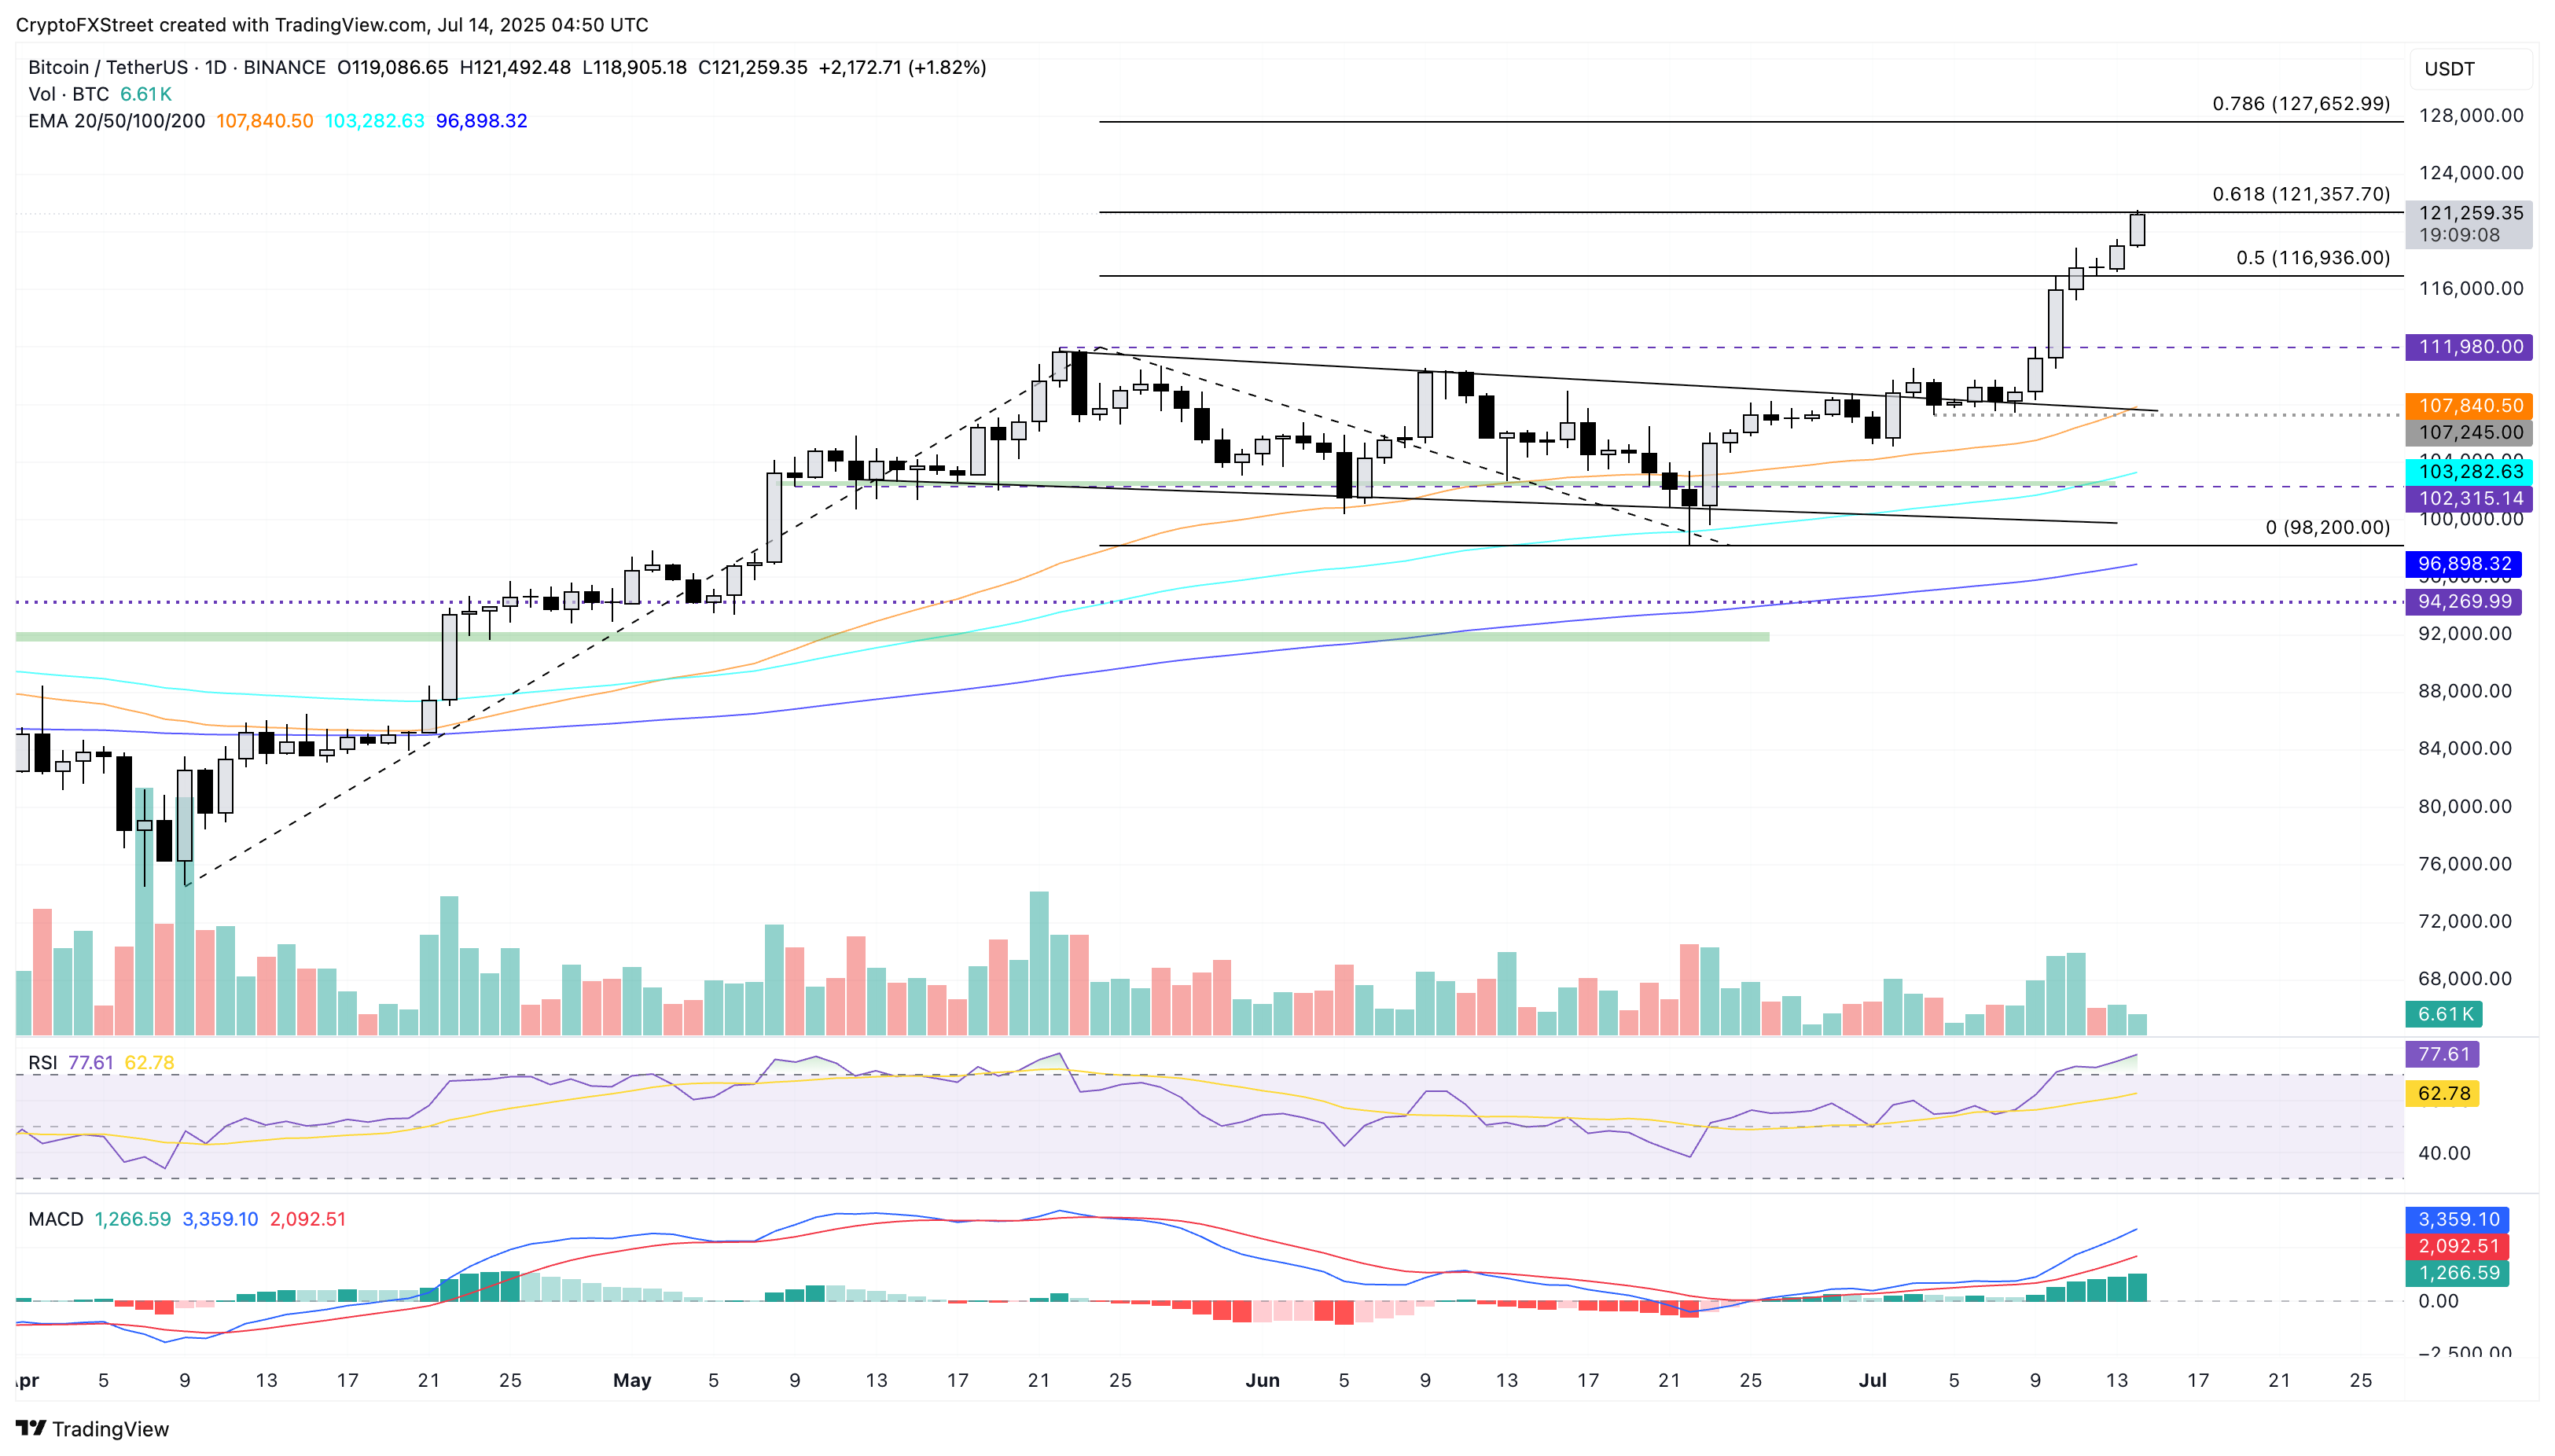
BTC/USDT daily price chart.
If BTC reverses from the 61.8% Fibonacci level at $121,357, it could extend the declining trend to the 50% level at $116,936.
Ethereum exceeds $3,000 as uptrend gains traction
Ethereum appreciates over 2% on the day at the time of writing, exceeding the $3,000 milestone for a new five-month high. The biggest altcoin inches closer to the 61.8% Fibonacci retracement level at $3,067 drawn from the December 16 high of $4,107 to the April 9 low of $1,385.
A decisive close above this level could extend the uptrend towards the 78.6% Fibonacci level at 3,525.
The 50-day Exponential Moving Average (EMA) crossing above the 200-day EMA marks a golden crossover, generally considered to be a buy signal.
The technical indicators indicate a surge in bullish momentum as the RSI at 74 highlights overbought conditions alongside the green histogram bars rising on the MACD indicator.
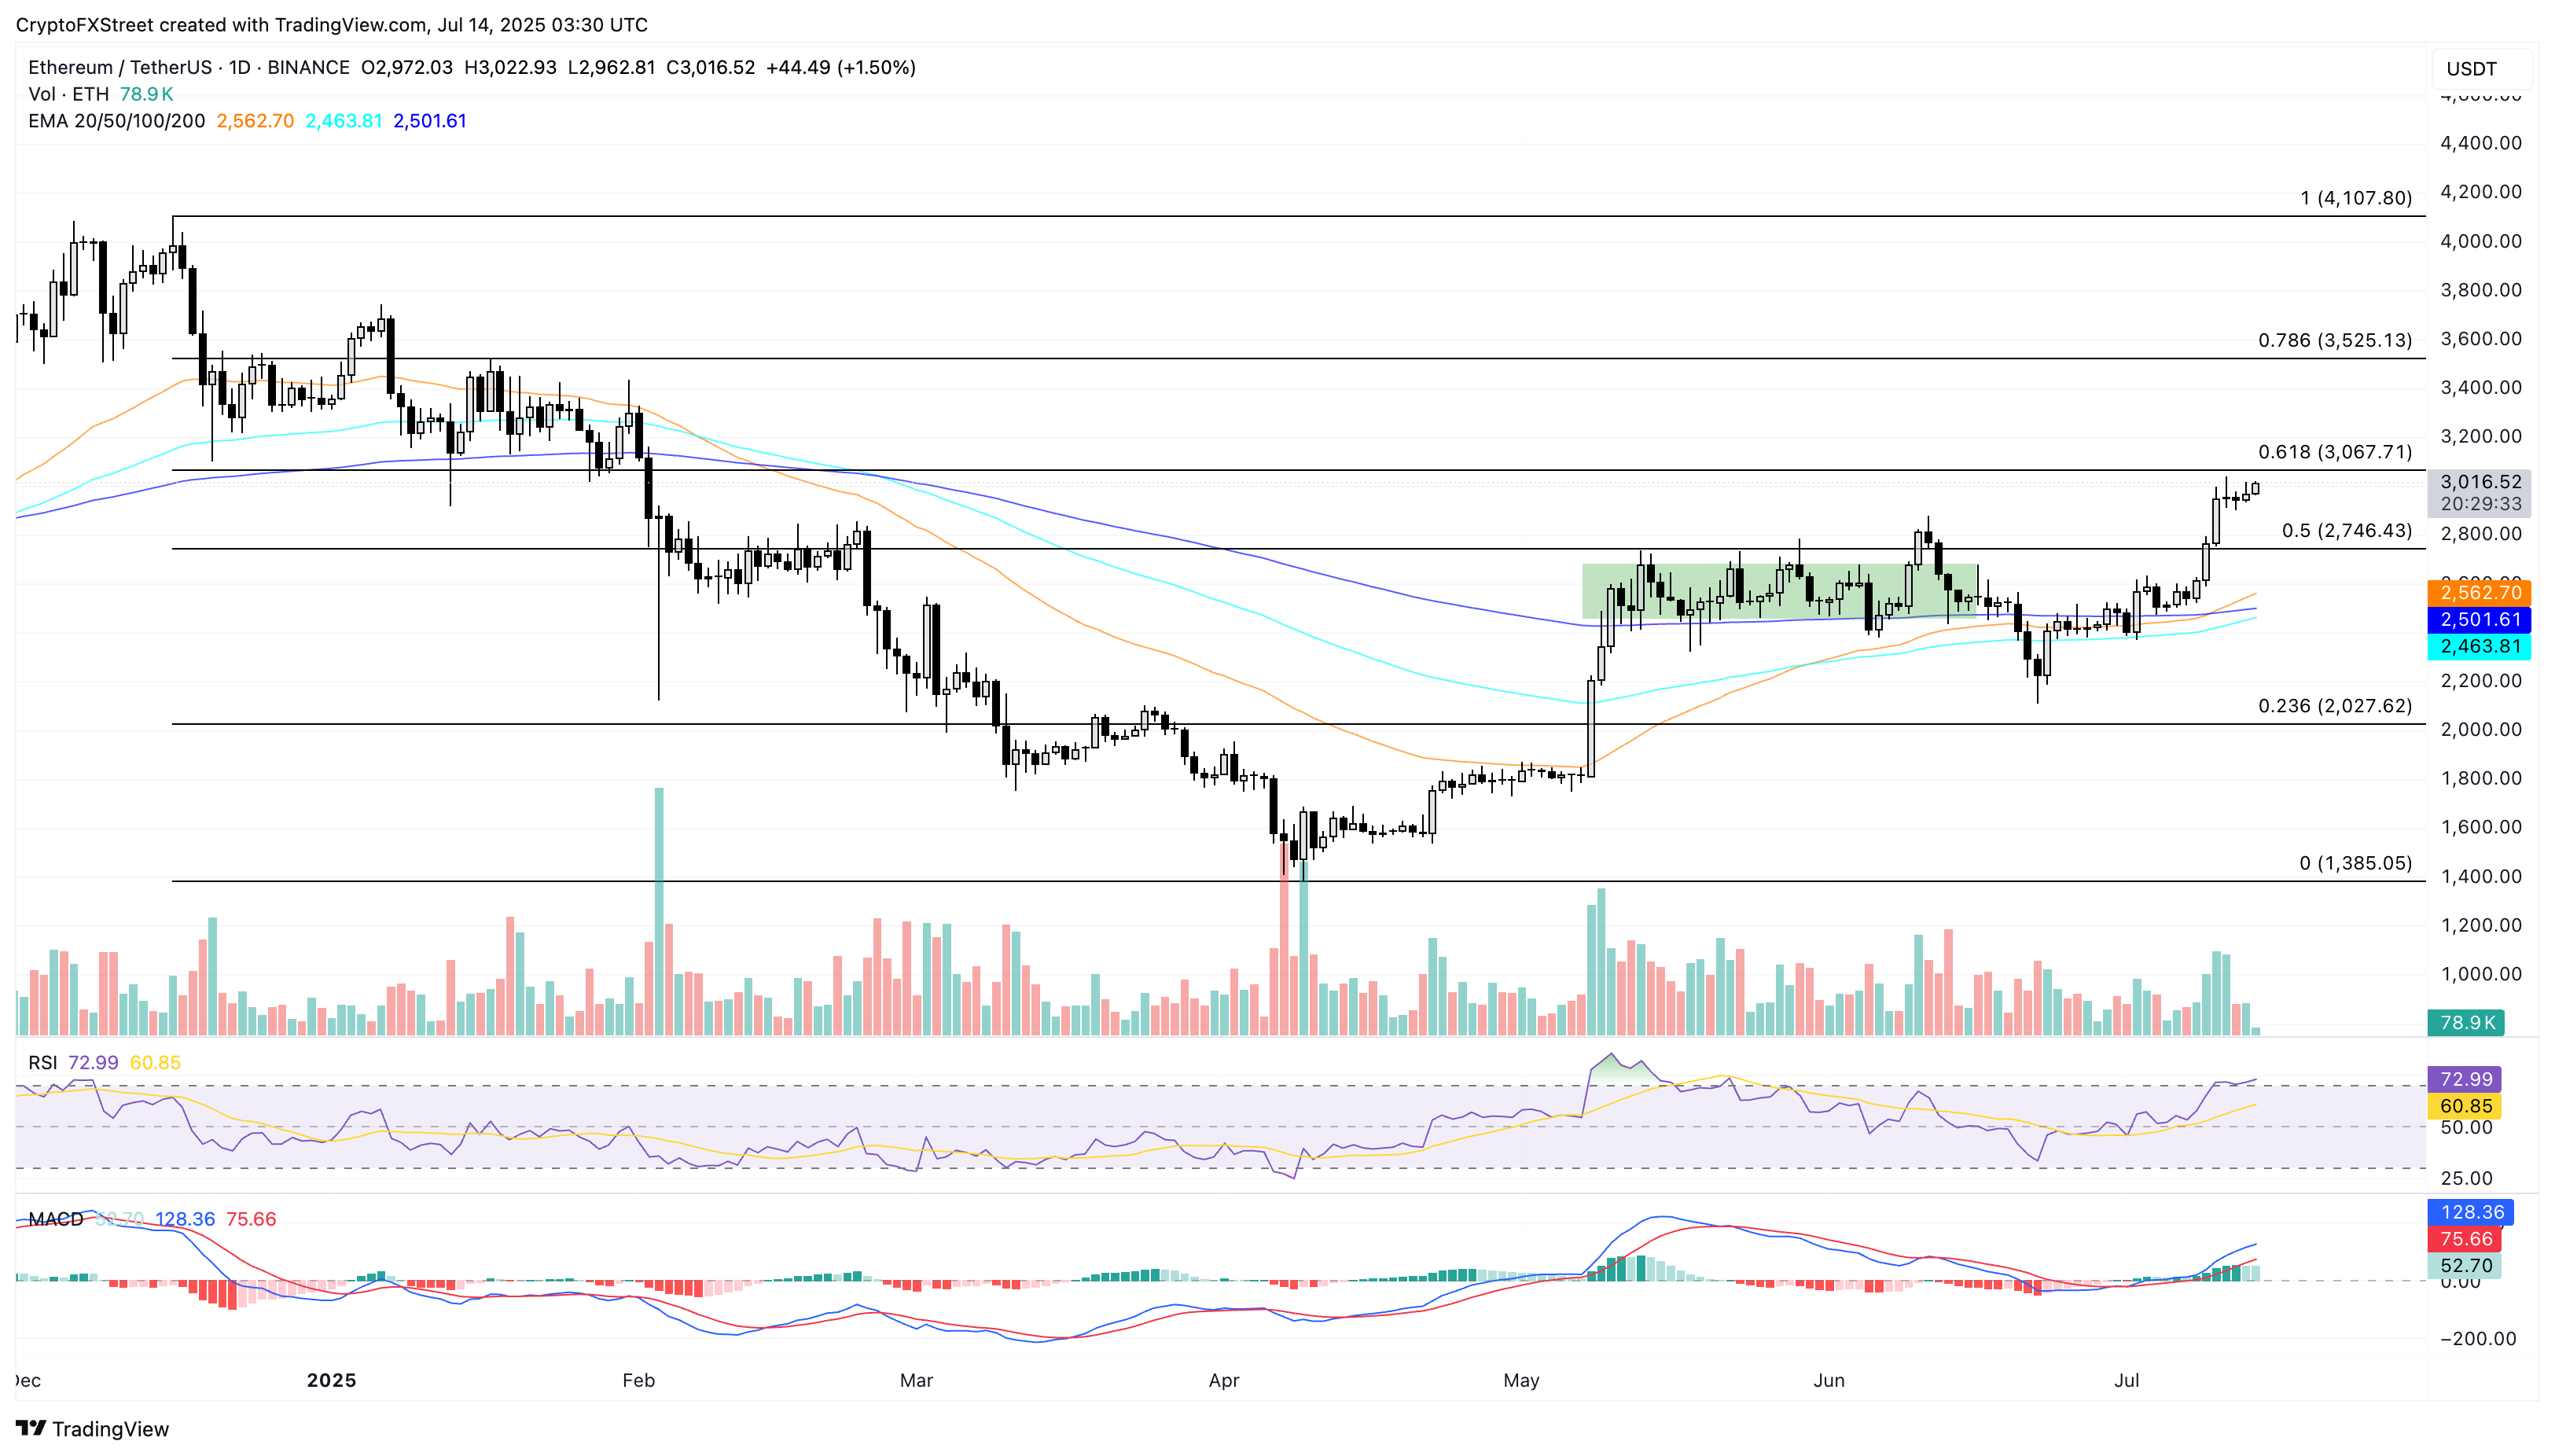
ETH/USDT daily price chart.
On the contrary, if Ethereum reverses from the $3,067, it could result in a retest of the 50% Fibonacci level at $2,746.
XRP’s trend reversal rally eyes $3 breakout
Ripple’s XRP trades higher by over 3% on Monday so far, building on the 24% rise from last week. The cross-border payment token marks the breakout of a resistance trendline formed by the highs of January 16 and May 12.
As XRP rises towards the $2.99 resistance level marked by the high of March 2, a daily close above it could extend the uptrend towards the $3.29 level, last tested on January 20.
According to the RSI at 83, XRP is extremely overbought at current levels after the parabolic rise. Still, the MACD indicator suggests a surge in bullish momentum as the green histogram bars surge from the zero line.
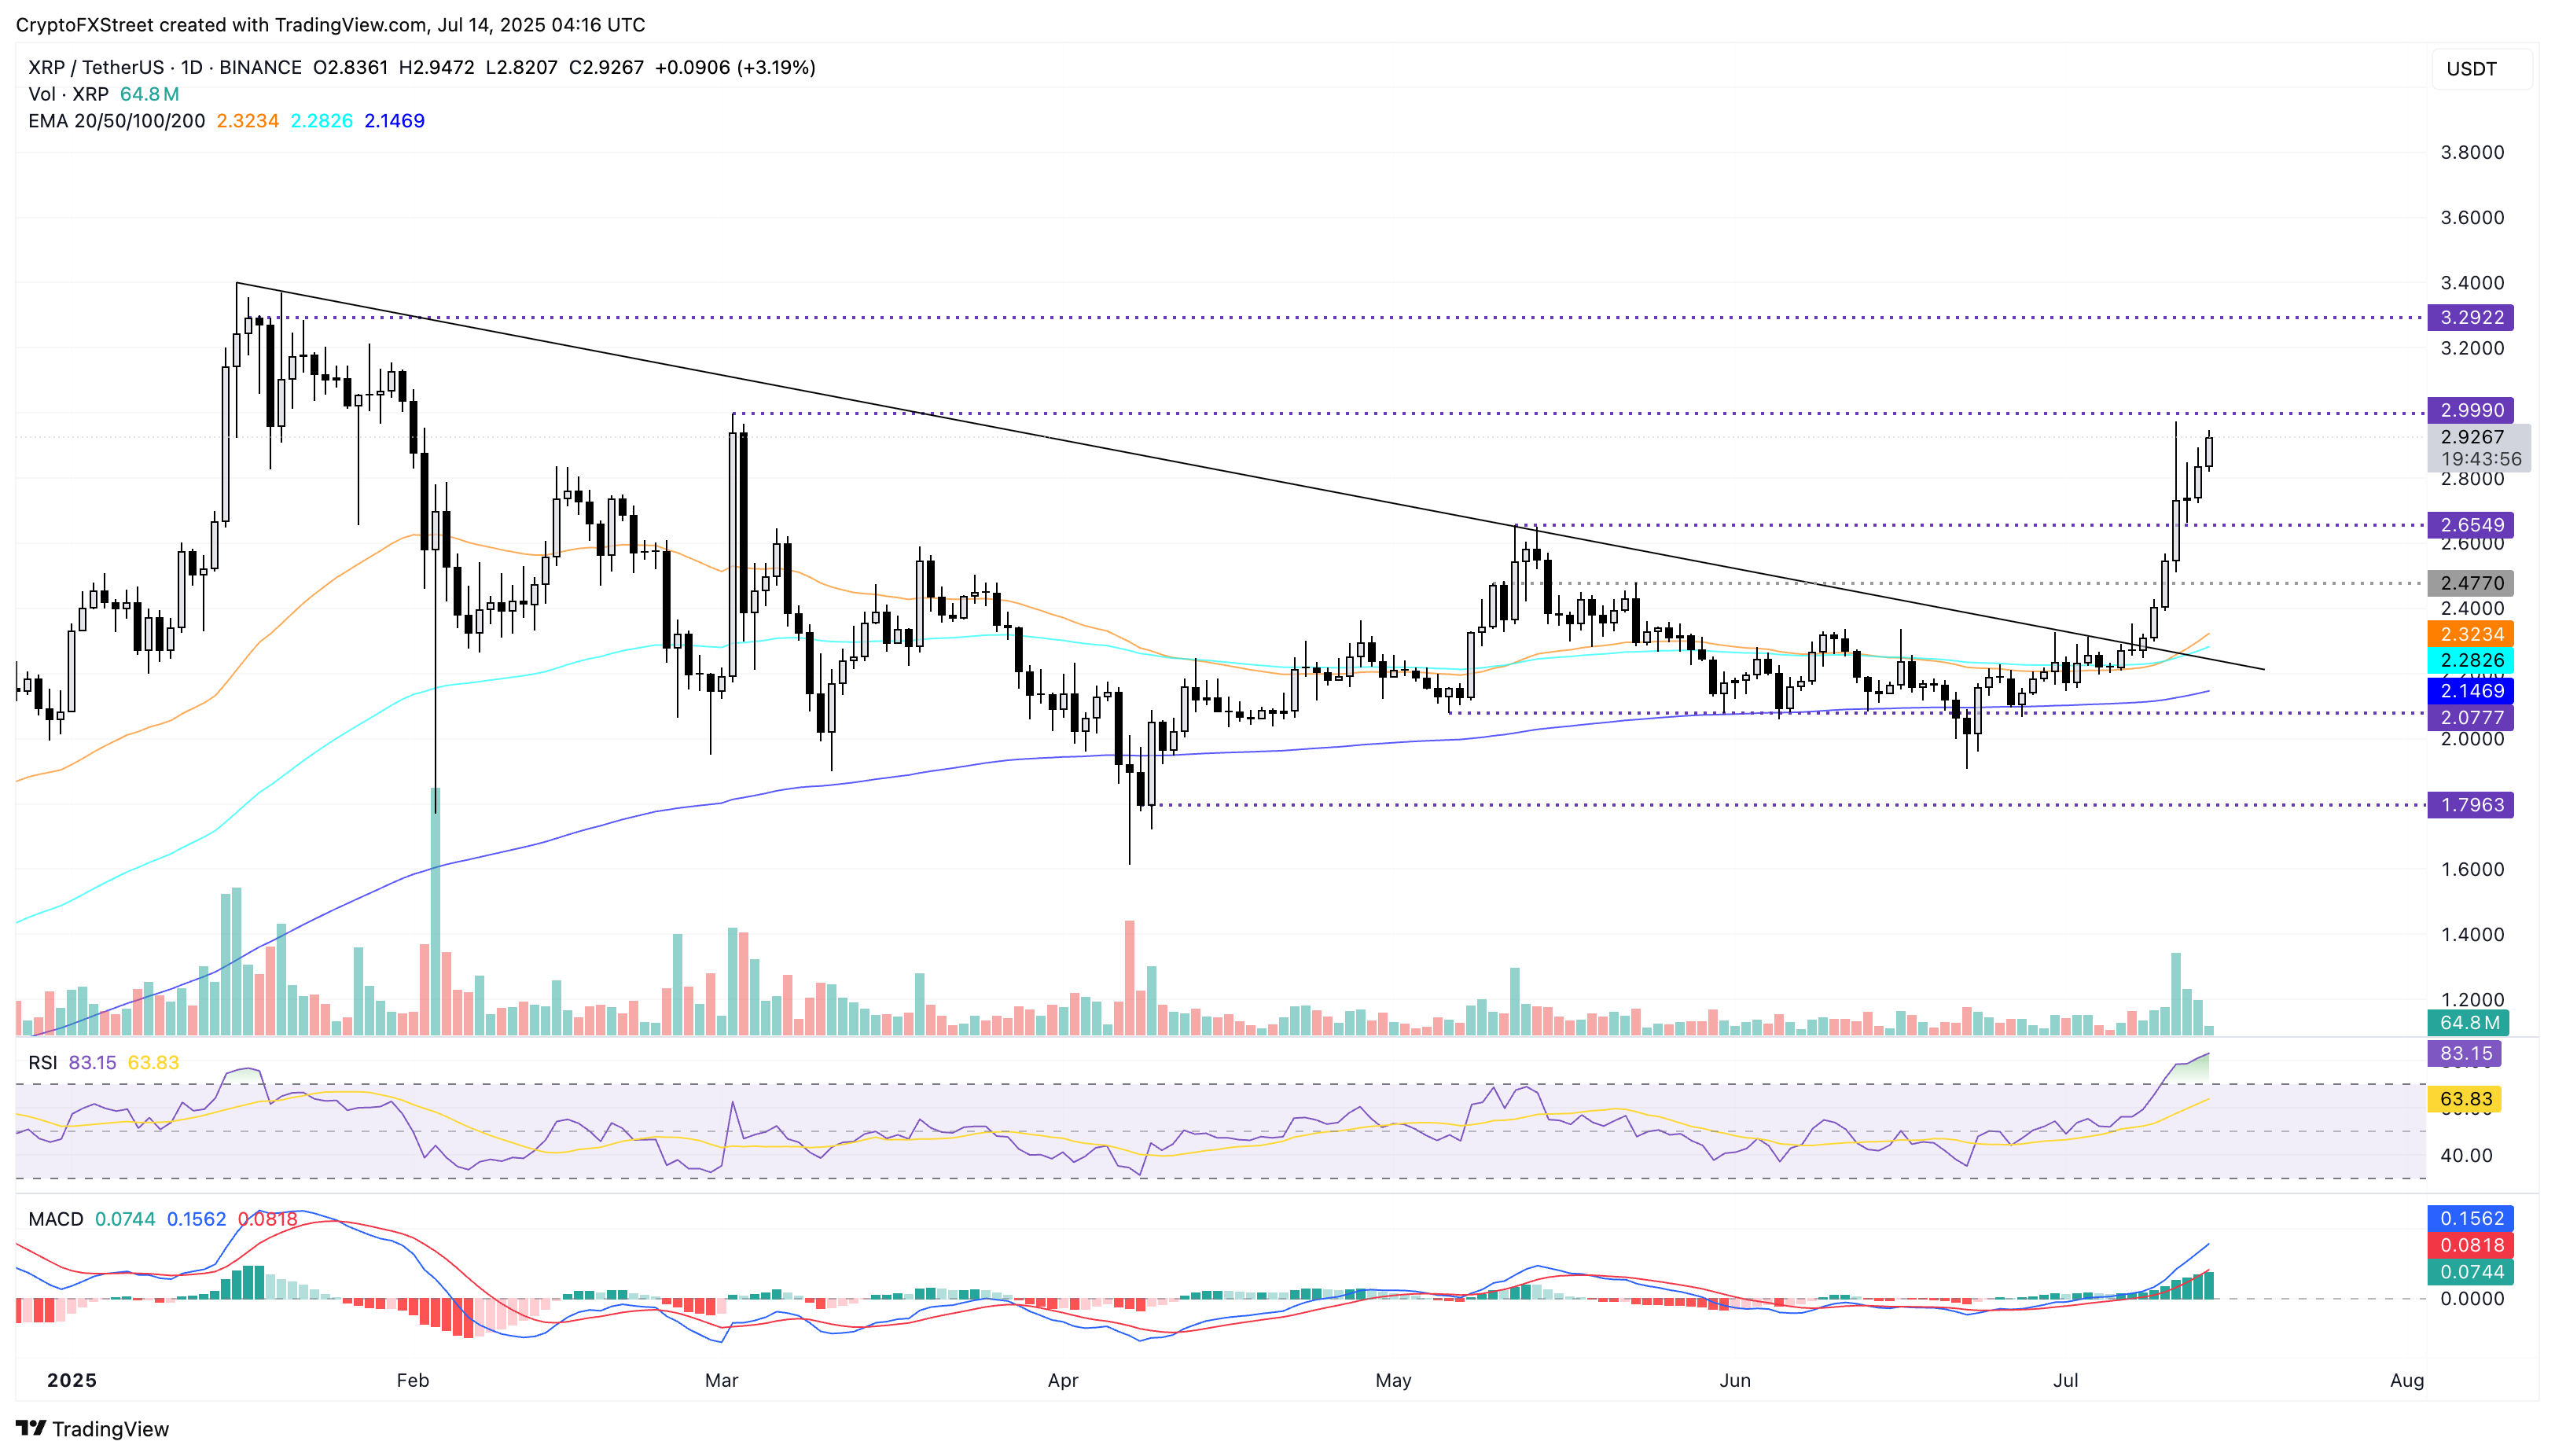
XRP/USDT daily price chart.
On the downside, a reversal in XRP could retest the $2.65 support level last tested on Saturday.