


- US-China trade talks conclude with the reinstatement of rare earth exports and the implementation of the Geneva Consensus.
- The Bitcoin price lowers slightly to near $110,000 as investors digest the outcome of the US-China talks.
- Ethereum holds above the previous consolidation range, with technical support at $2,700.
- XRP uptrend slows below $2.33, mirroring a SuperTrend sell signal while maintaining confluence support at $2.26.
The cryptocurrency market is generally holding onto most of the gains accrued during the euphoric rally on Monday, when Bitcoin (BTC) cracked the resistance at $111,000 to post weekly highs at around $110,516. Meanwhile, the largest digital asset by market capitalization hovers at $109,274 at the time of writing on Wednesday, down over 0.5% on the day as investors digest the aftermath of the trade talks between the United States (US) and China.
Leading altcoins, including Ethereum (ETH), Ripple (XRP) and Solana (SOL), are clinging to most of the gains accrued this week. However, they face a lack of trader conviction to keep the uptrend steady, plausibly awaiting a delayed reaction to the trade agreement between the US and China.
Market overview: US-China agree to ease export curbs, uphold tariff truce
US and Chinese officials announced on Tuesday that they had reached a mutual agreement on a framework to uphold the Geneva tariff truce and ease export restrictions, particularly on rare earths. The second round of trade talks, which began on Monday and concluded on Tuesday, will see China remove curbs on the export of rare earth minerals and magnets. At the same time, the US reinstates the export of key components, including semiconductor design software and aircraft parts, to the Asian economic giant.
“We have reached a framework to implement the Geneva consensus and the call between the two presidents,” US Commerce Secretary Howard Lutnick told reporters. “And if that is approved, we will then implement the framework,” Lutnick added.
China’s Vice Commerce Minister Li Chenggang reiterated the agreement, awaiting the approval of President Xi Jinping.
While the trade agreement reached in London could ease trade and relieve global markets, a long-term solution remains distant. According to a Reuters report, the World Bank reduced its global forecast for 2025 by four-tenths of a percentage point to 2.3% on Tuesday, citing higher tariffs and continued uncertainty that threaten most economies.
Data spotlight: Spot ETF volumes surge
Optimism for a trade deal between the US and China reignited interest in risk assets, with Bitcoin spot Exchange Traded Funds (ETFs) experiencing inflows resuming on Monday after two consecutive days of net outflows. SoSoValue data highlights that BTC spot ETFs posted approximately $431 million in net inflows on Tuesday, up from $386 million seen on Monday.
An increase in interest in Bitcoin-related products could help stabilize the uptrend, which is currently approaching an all-time high of around $111,980.
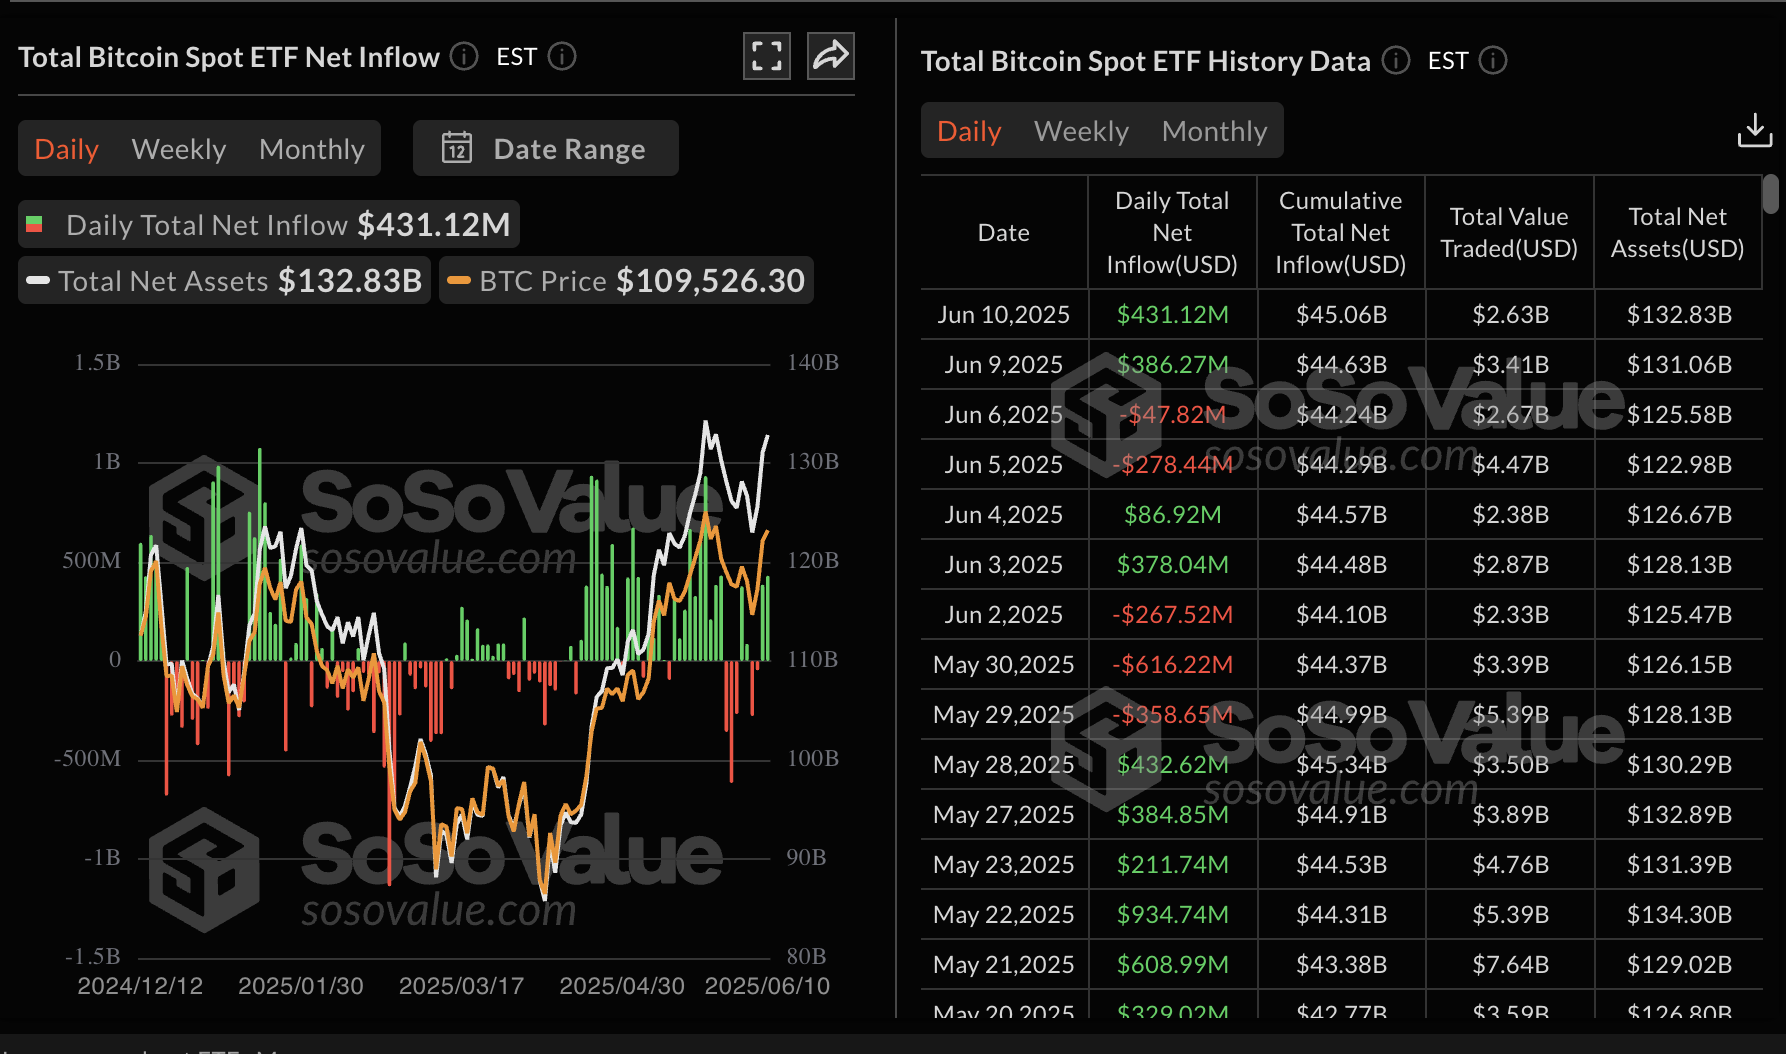
Bitcoin spot ETF volume | Source: SoSoValue
The largest smart contacts token, Ethereum, has maintained a positive streak over the last 16 days, with spot ETFs recording net inflows. The total daily net inflow on Tuesday surged to $124, the highest level since May 21.
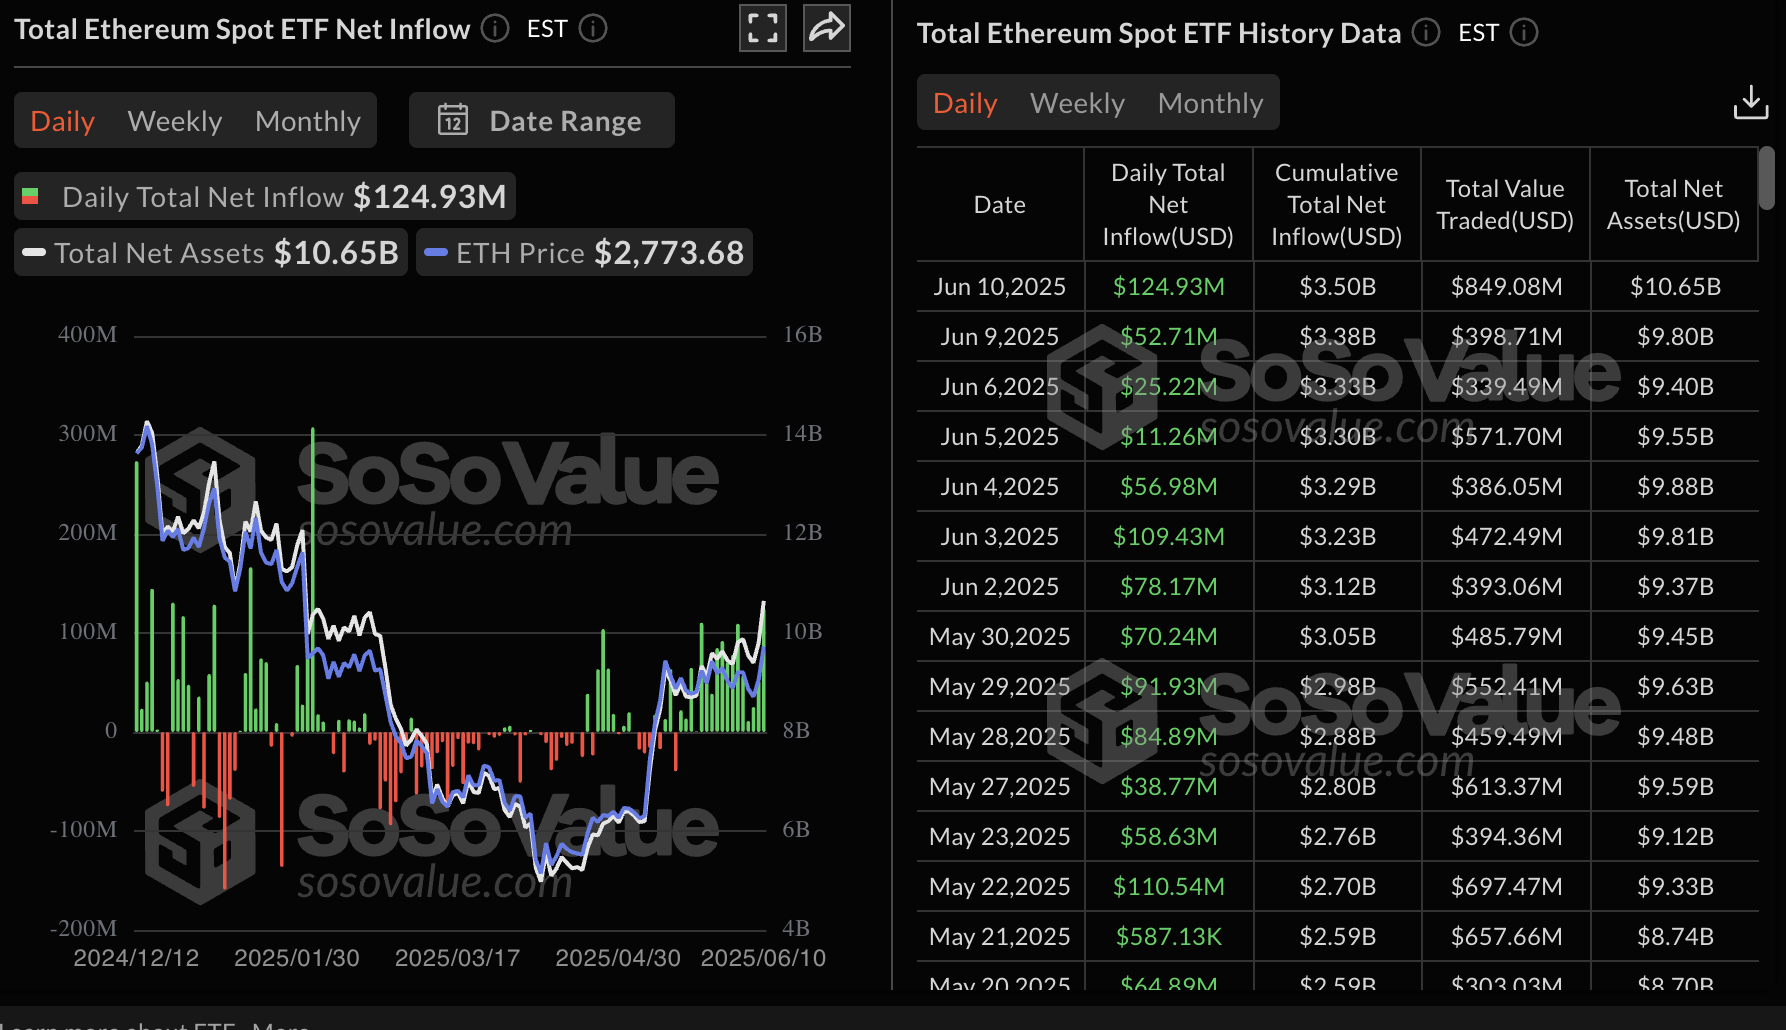
Ethereum spot ETF volume | Source: SoSoValue
Should investors maintain interest in Ether, increasing exposure to related products like spot ETFs, the path of least resistance could remain upward, potentially closing the gap to $3,000.
Chart of the day: Could Bitcoin bulls lose grip on the uptrend?
Bitcoin’s price is cooling from the early week rally above $110,000 to trade at $109,274 at the time of writing. The downtrend indicated by the Relative Strength Index (RSI) indicator on the daily chart suggests that bears could continue to gain momentum in upcoming sessions, especially if the pullback from the current 60 level extends below the 50 midline.
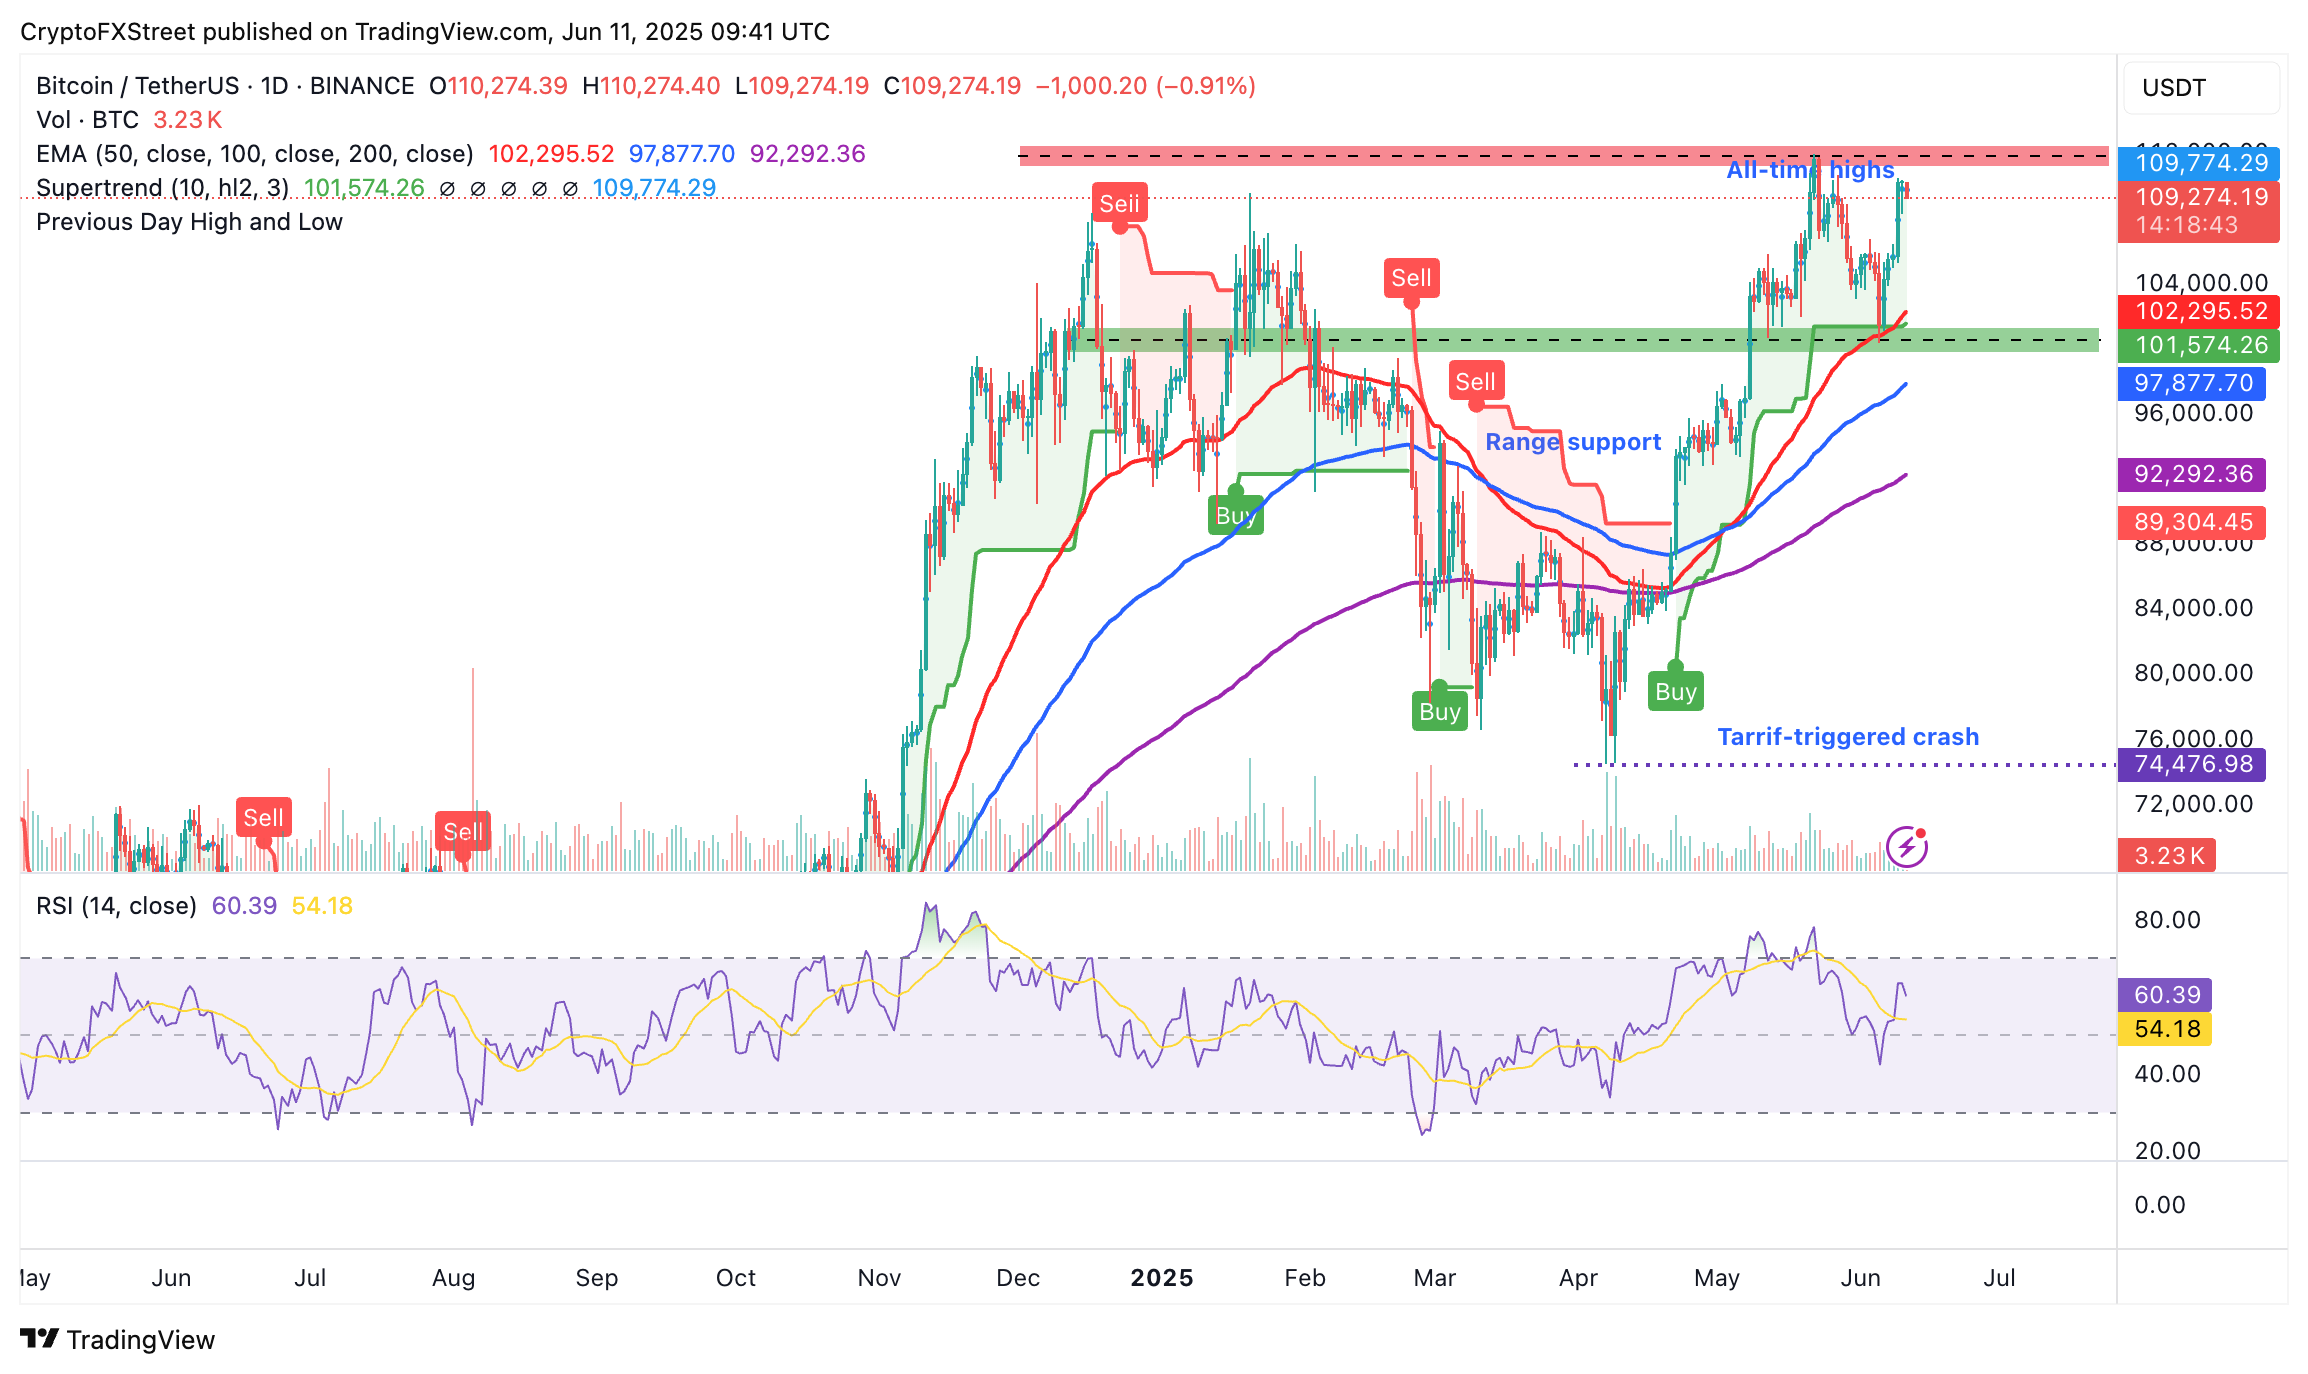
BTC/USD daily chart
However, it would be prudent for traders to temper bearish expectations, especially with the 50-day Exponential Moving Average (EMA) currently at $102,295, the 100-day EMA at $97,877 and the 200-day EMA at $92,292, pointing north. In other words, BTC’s uptrend remains largely intact, with the potential to resume its recovery above $110,000 if market sentiment improves.
Altcoins update: Ethereum and XRP uptrend stalls
Ethereum’s price extended gains above the range limit at $2,700 on Tuesday before stalling at around $2,834. The leading smart contracts token has corrected to exchange hands at $2,760 at the time of writing, while holding above the consolidation range support marked in red in the chart below at around $2,700.
A daily close above the key support could reinforce the uptrend, encouraging traders to seek exposure to ETH. Additionally, the SuperTrend indicator has continued to sustain a buy signal, which was first flashed on May 8, indicating bullish momentum. This buy signal occurs when the price crosses above the SuperTrend line, changing its color from green to red. If this trend-following tool continues to function as a dynamic support and trailing the price of Ethereum, the probability of closing the gap to $3,000 would swell significantly.
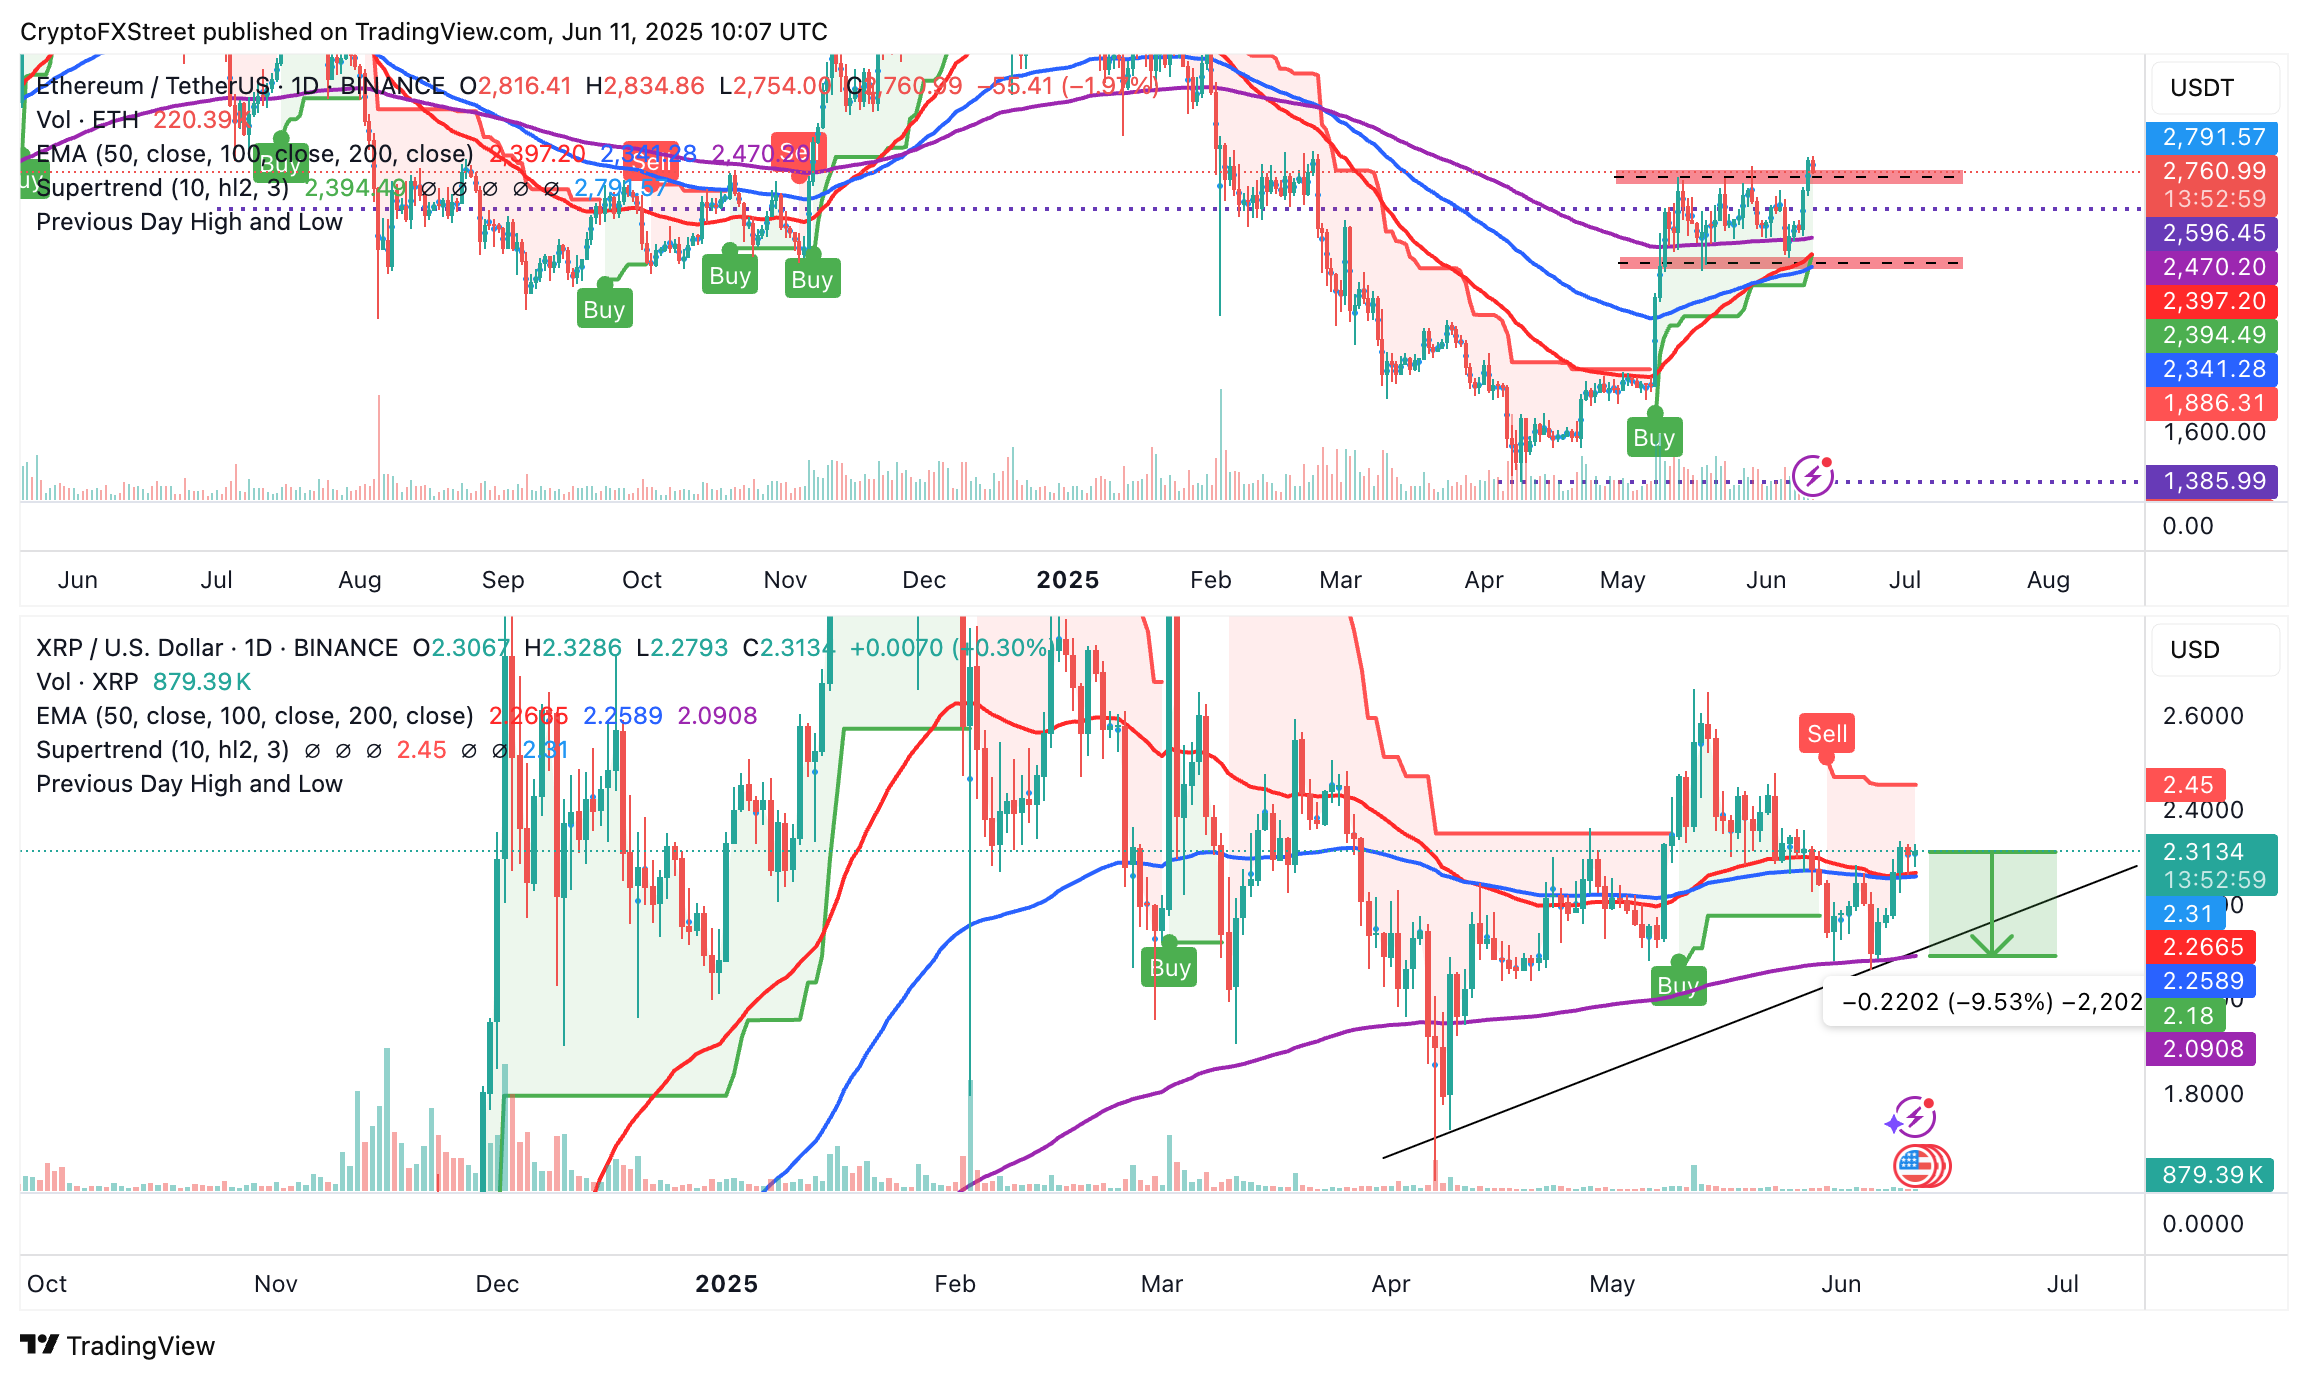
ETH/USDT & XRP/USDT daily charts
Meanwhile, the XRP price uptrend is wobbling at $2.31, gesturing to trader indecision and possible consolidation before the next breakout. Slightly below the current level, the cross-border money remittance token upholds support at $2.26, established by the 50-day EMA and the 100-day EMA confluence.
A SuperTrend sell signal validated on May 30 hints at a developing bearish outlook. If traders reduce exposure to XRP, reflecting the sell signal as a dynamic resistance, the decline could extend below the confluence support, bringing the 200-day EMA at $2.09, which is 9.5% below the current price level, into sight.