- Bitcoin price breaks above the daily resistance level at $56,000, hinting at some modest signs of recovery after last week’s sell-off.
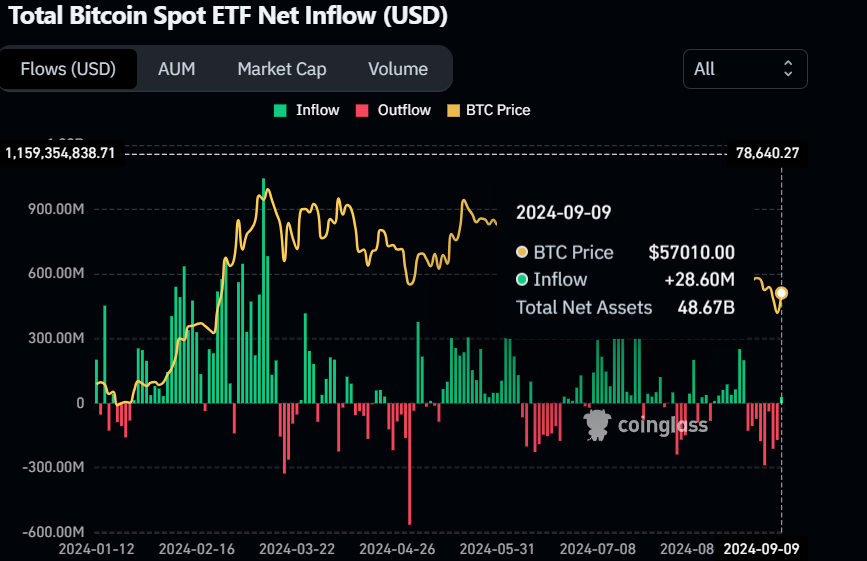
- US spot Bitcoin ETFs recorded a mild inflow of $28.60 million on Monday, breaking a streak of outflows that was underway since August 27.
- On-chain data shows a sign of recovery, with BTC’s long-to-short ratio above one and rising holdings of stablecoins on exchanges.
Bitcoin (BTC) trades just above $57,000 on Tuesday after gaining almost 4% on Monday, buoyed by mild ETF inflows, increasing whale buying activity during price dips, a long-to-short ratio above one, and increasing stablecoin holdings on exchanges.
Daily digest market movers: Some signs of recovery
- US spot Bitcoin ETFs recorded a mild inflow of $28.60 million on Monday, breaking their long outflow streak that started on August 27, according to CoinGlass data. This is a sign of slightly improving market sentiment. However, it is relatively minor compared to the $48.67 billion in total Bitcoin reserves held by the 11 US spot Bitcoin ETFs and taking into account the significant outflows that Bitcoin ETFs have registered since the beginning of the month.


Bitcoin Spot ETF Net Inflow chart
- Lookonchain data shows that a whale created a new wallet and withdrew 300 BTC, worth $17.19 million, from Binance on Monday.
Additionally, from September 1 to September 3, some other whales bought 2,814 BTC worth $157.3 million from Binance, with an average price of $55,887. This indicates that large investors are buying to try to get a profit from the recent BTC price dips.
- Moreover, Coinglass’s Binance Bitcoin’s long-to-short ratio is at 1.69, its highest since August 27, meaning more traders anticipate the asset’s price to rise.

Binance Bitcoin’s long-to-short ratio chart
- CryptoQuant data shows that the holdings of stablecoins are increasing on exchanges. When stablecoins flow into exchanges, it is generally interpreted as funds waiting to buy, which could have positive effects on prices. However, increasing holdings does not necessarily mean the price will rise. The value of stablecoins holdings on exchanges has risen from $20.82 billion in early August to $24.99 billion on Monday, signaling investors are waiting to buy.
%20(1)-638615634855855752.png)
Stablecoins holding on all exchanges chart
Technical analysis: BTC breaks above $56,000
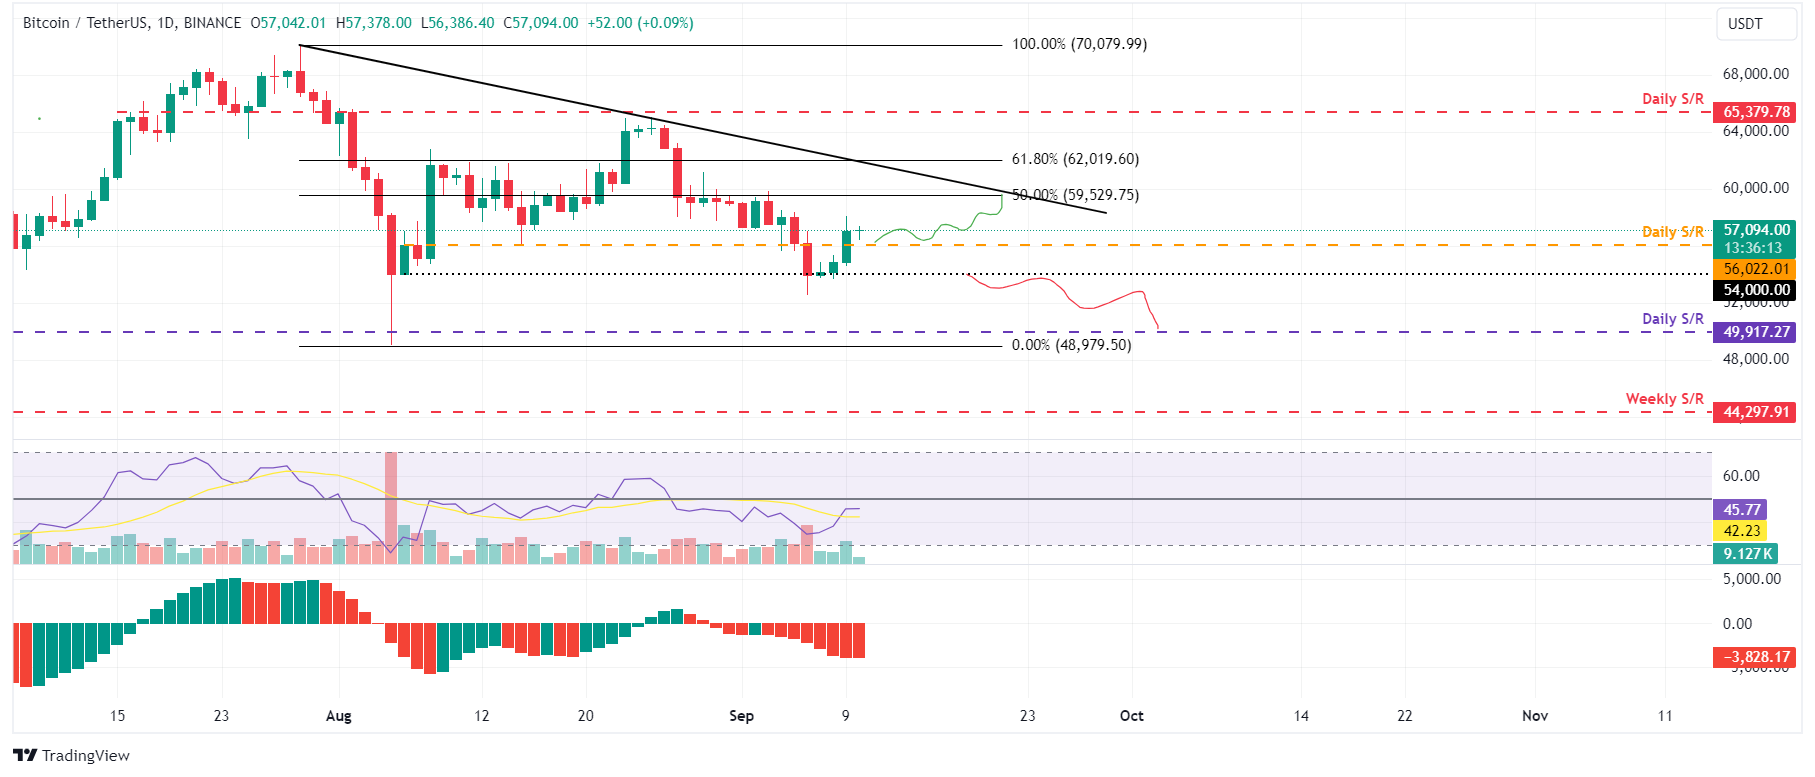
Bitcoin price retested and found support around the $54,000 level on Saturday, bouncing 5.5% the next two days. It broke and closed above the $56,022 daily resistance level on Monday. At the time of writing on Tuesday, it trades slightly above $57,094.
If the $56,022 continues to hold as support, BTC could rise 4% from its current trading level to retest its 50% price retracement level at $59,529 (drawn from a high in late July to a low in early August).
The Relative Strength Index (RSI) on the daily chart is hovering around its neutral level of 50, indicating indecisiveness among investors. The Awesome Oscillator (AO) still trades well below its neutral level of zero. Both indicators should trade above their respective neutral levels for any upcoming recovery rally to be sustained.

BTC/USDT daily chart
This bullish thesis will be invalidated if Bitcoin price closes below the $54,000 support level. In this scenario, BTC could decline by an additional 7% and retest the next daily support at $49,917.


