- Bitcoin spot ETFs record a $174.5 million outflow on Monday, marking seven consecutive days of continuous decline.
- Mt.Gox announces Bitcoin and Bitcoin Cash repayment to creditors in July.
- Bitcoin price breaks below the descending wedge pattern, indicating a bearish trend.
Bitcoin (BTC) price rebounds slightly on Tuesday, hovering around $61,000, after dipping 4.6% on Monday, when it broke below the descending wedge pattern. Mt.Gox’s announcement of Bitcoin and Bitcoin Cash repayment to creditors in July coincided with a $174.5 million outflow from Bitcoin spot ETFs, marking seven consecutive days of continuous outflows.
Daily digest market movers: Bitcoin spot ETFs record seven days streak outflows
- According to data from Coinglass, the Bitcoin spot ETF recorded a $174.5 million outflow on Monday, marking seven consecutive days of continuous outflows totaling $1.13 billion from June 13 to June 24. This increase in ETF outflows typically indicates a shift in investor sentiment or strategy, potentially signaling bearish sentiment or profit-taking in the market. The 11 spot BTC ETFs hold $52.47 billion in Bitcoin reserves.
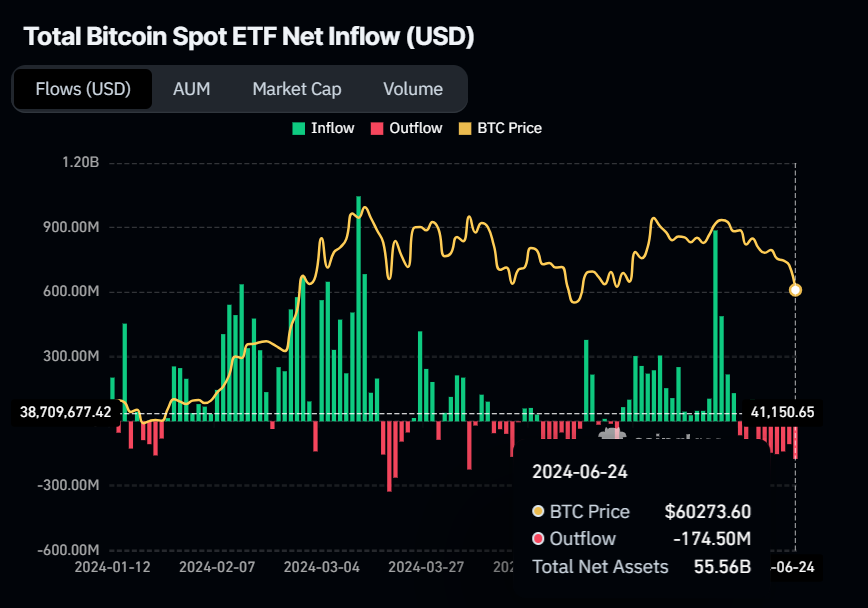
Bitcoin spot ETF chart
- Mt.Gox, a defunct cryptocurrency exchange platform exploited in 2014, announced plans to repay Bitcoin and Bitcoin Cash to creditors in July. The exchange’s users had previously suffered losses totaling nearly $9 billion in cryptocurrencies. This announcement may have sparked FUD (Fear, Uncertainty, Doubt), contributing to the 4.6% price decline Bitcoin suffered on Monday.
Technical analysis: BTC breaks below descending wedge
Bitcoin price broke below the descending wedge on Monday, declining approximately 7.5% from its daily high of $63,369 to a low of $58,402. After retesting its crucial weekly support near $58,375, BTC rebounded by 3.3%, closing at $60,293. BTC trades at around $61,000 at the time of writing, edging up more than 1% on Tuesday.
If the weekly support at $58,375 holds, Bitcoin could encounter resistance at several key levels.
- The lower trendline of the descending wedge, which sits around $62,000.
- The daily resistance and the upper trendline of the descending wedge, which hovers near $63,956.
- The 61.8% Fibonacci retracement level and the weekly resistance are at $66,631 and $67,147, respectively.
A breakthrough above these resistance barriers could propel BTC’s price towards retesting the next weekly resistance at $71,280.
The Relative Strength Index (RSI) is currently in the oversold territory on the daily chart, while the Awesome Oscillator (AO) is below its mean level. For bulls to stage a convincing comeback, both momentum indicators must sustain positions above their respective thresholds of 50 for RSI and zero for AO. Still, the RSI is about to exit the oversold level after briefly dipping into it, a sign to cover shorts and open longs. This scenario could bolster the ongoing recovery rally.
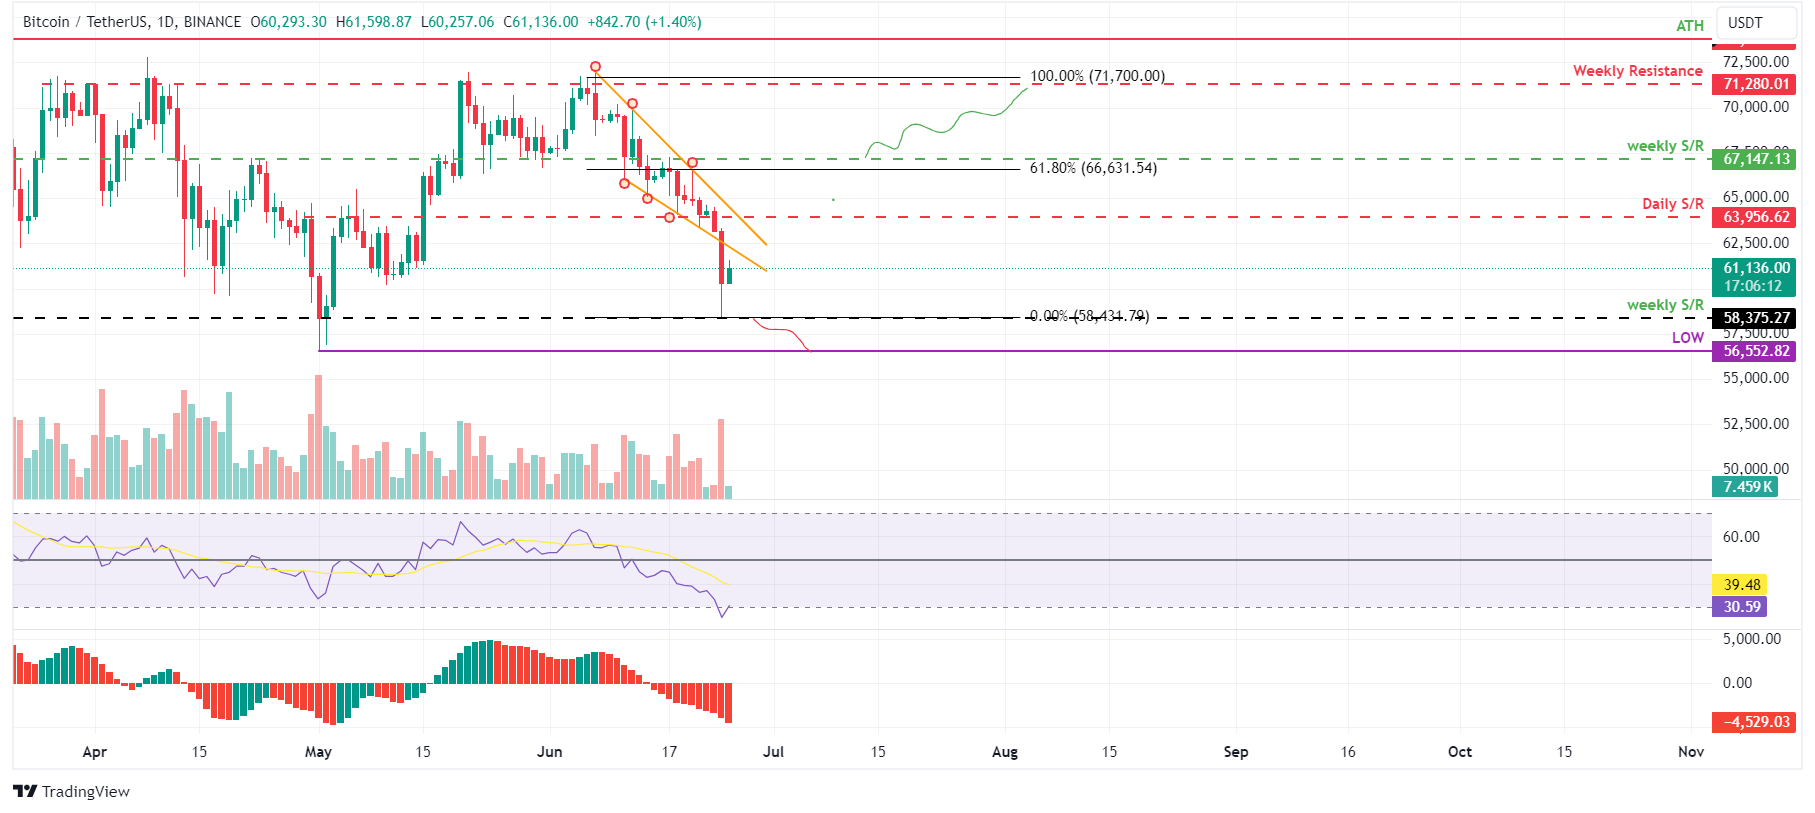
BTC/USDT daily chart
However, if BTC closes below the $58,375 level and forms a lower low on the daily time frame, it could indicate that bearish sentiment persists. Such a development may trigger a 3% decline in Bitcoin’s price, revisiting its previous low of $56,552 from May 1.