- Bitcoin price drops back to $60,660 support level for third time this week.
- Asia has been trying, but American session proved worst performer this week. Europe has been front-running US session selling.
- Billionaire real estate investor Barry Sternlicht says he expects at least one bank failure per week.
Bitcoin (BTC) price has consistently shown weakness in the US session, relative to when Asian markets opened this week. It comes despite crypto taking center-stage in US Election campaigns.
Also Read: Bitcoin price dips to $61K but defends one of its most resilient macro uptrends ever
Daily digest market movers: Bitcoin in the red as price correction ensues in US session
In the week ending Saturday, May 11, Bitcoin price started the Asian session with a show of strength, before tables started to turn in the late hours of the European session and worse in the US session.
Can the Americans pls stop selling?
— Miles Deutscher (@milesdeutscher) May 10, 2024
The commendable performance for the Asian session comes as Hong Kong and China continue to show euphoria over the recently-launched spot BTC and Ether ETFs.
The mania becomes intense following reports that one of the issuers, Chinese fund house Harvest Global Investment, may be considering seeking approval to trade in mainland China via the Connects Program. Notably, mainland China has been the biggest buyer of Hong Kong ETFs in the past three years, making this a huge move.
The New York session often sees increased trading activity and higher volatility compared to other sessions, which can lead to more fluctuations in Bitcoin prices. News and announcements occurring during the American session are majorly focused on US election campaigns, regulatory developments, economic data releases and geopolitical tensions, increasing volatility for BTC.
More specifically, trading patterns specific to the American session may influence Bitcoin’s performance during this time.
Meanwhile, Billionaire real estate investor Barry Sternlicht says he expects at least one bank failure per week in the US, Fortune reports.
Billionaire Barry Sternlicht predicts a wave of bank failures, expecting at least one bank to fail weekly, due to the ongoing real estate market collapse, as reported by Fortune. pic.twitter.com/j5tg0IN1VS
— The Daily Flame (@TheDailyFlame_) May 10, 2024
In times of financial instability or uncertainty, some investors may turn to alternative assets like Bitcoin as a “safe haven” to protect their wealth.
If there are concerns about the stability of the traditional banking system due to bank collapses, it could potentially lead to an increased demand for Bitcoin and drive up its price.
Technical analysis: Support at $60,660 proves critical for Bitcoin
After three successful retests of the $60,660 support level, this buyer congestion base has proven critical for Bitcoin price. However, it may not be enough to sustain an uptrend unless the bulls are able to haul BTC to the other crucial level of $63,039, where bullish activity waits to interact with Bitcoin price. The yellow spikes of the volume profile show this.
Bitcoin price faces immediate resistance from the Smooth Moving Average (SMMA) at $62,466, beyond which a decisive flip above $63,039 would encourage more buying activity. However, the weekly high of $65,500 is also a critical level to beat for BTC. A stable candlestick close above this level on the one-day time frame would solidify the uptrend, setting the pace for a continuation of the uptrend.
In a highly bullish case, Bitcoin price could break past the upper band of the Bollinger Bands indicator at $67,224, before flipping the $70,000 threshold into support. This would give the bulls a shot at retaking the $73,777 all-time high before further upside potential.
As reported in a previous article, Bitcoin price is also consolidating within a falling wedge pattern, the profit objective of which is a 20% breakout to the estimated target of $76,116.
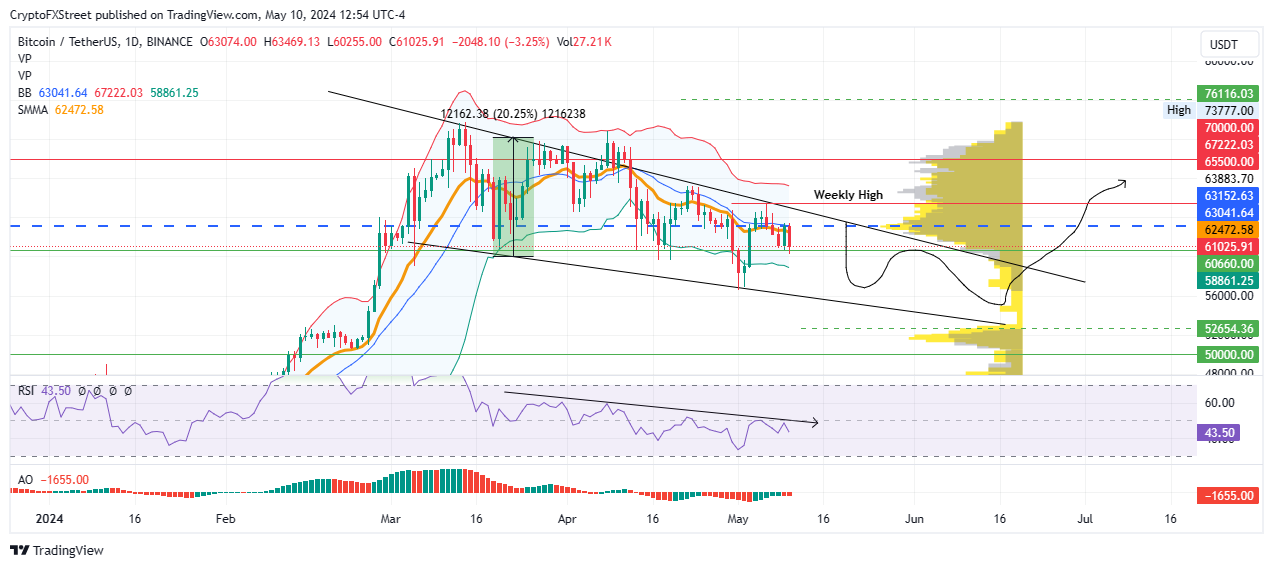
BTC/USDT 1-day chart
On the other hand, if the $60,660 support breaks, Bitcoin price could extend the fall. While a slip below the lower boundary of the Bollinger Bands indicator at $58,854 would be concerning, only a one-day candlestick close below $56,000, and effectively the lower trendline of the falling wedge would invalidate the bullish thesis.
Both the Relative Strength Index (RSI) and the Awesome Oscillator (AO) momentum indicators are below their respective mean levels. Also, the RSI continues to record lower highs since late March. This not only points to prevailing bearish sentiment in the market but also tilts the odds further in favor of the downside.