- Bitcoin price has dropped by around $7,000 on Tuesday as markets shake off Easter holiday.
- BTC RSI is at levels last seen when Bitcoin price was at $41,800.
- The 200-day EMA remains critical in preventing an extended fall.
Bitcoin (BTC) price is trading with a bearish bias as markets succumb to volatility resulting from low trading volumes coming out of a prolonged weekend. However, there is concern as the BTC RSI is at levels last seen in January when the ETF narrative was catching steam.
Also Read: Bitcoin whales position themselves for pre-halving pump
Bitcoin RSI resets to levels last seen before ETF inflows went berserk
Bitcoin price crashed from $71,366 to $64,588 in less than 48 hours. The nearly $7,000 crash liquidated nearly $700 million in positions across the market between Monday and the early hours of the US session on Tuesday.
The dump comes after the upward momentum for BTC disappeared, and sellers took over the market. According to some analysts, the drop is a typical shake off, intended to wipe out the weak hands.
It has not escaped the eyes of analysts that the BTC Relative Strength Index (RSI) has dropped below 50, resetting to levels last seen during the last week of January when Bitcoin price was around $41,800. Specifically, this was just before the exchange-traded fund (ETFs) inflows started to explode.
Nevertheless, reports indicate that weekly ETF flows are positive again after seesawing between a slowdown and more outflows compared with inflows. This should keep hope alive for BTC bulls.
LATEST: Weekly ETF Flows Are Positive Again!
After last week’s outflows this is very promising to see.
Don’t be fooled by the little shakeout, the bigger picture remains the same.
6-figure #Bitcoin is coming soon!!! pic.twitter.com/CoQKTMf7jb
— Kyle Chassé (@kyle_chasse) April 2, 2024
Elsewhere, Tether, the cryptocurrency stablecoin (USDT) pegged to the US Dollar, has moved 60 million USDT from its treasury to Kraken Exchange. The network has also donated $100,000 to BTCPay Server, so it can continue working on enabling anyone to accept BTC. This encourages adoption for the digital asset.
This is also reinforced by speculation that BTC ETFs will be added to UBS platform, which manages $3.5 trillion in global wealth and boasts around $98 billion in market capitalization. Notably, UBS integrating Bitcoin ETFs marks a significant shift in traditional finance’s embrace of crypto.
UPDATE: sources saying that #Bitcoin ETF’s will be added to @UBS platform next week and widely available.
– removal from PWM silo.
– removal of ‘unsolicited’ order restriction.
– @UBS manages $3.5T in global wealth.— Andrew (@AP_Abacus) April 2, 2024
It is a bullish move that erodes barriers for high-net-worth individuals to dive into digital assets. The adoption curve steepens as big players capitulate to crypto’s allure. In the latest, the US government has sent a possible test transaction of around 30,174 BTC worth $2.1 billion to Coinbase. The BTC is reportedly from the Silk Road hack funds.
30.1K BTC ($2.1B) of Silk Road hack funds controlled by US government is on the move right now.
0.001 BTC ($69) transferred to a Coinbase deposit address so it’s a test transfer possibly.
txn hash
9c3af4b48e66565f1da1da8278036fa1dbb09f2beaaca99c3504475390ba4590Coinbase…
— ZachXBT (@zachxbt) April 2, 2024
Bloomberg’s James Seyffart, an ETF analyst, has commented, “Government was simply waiting for Judge Failla to dismiss the SEC’s accusations that Coinbase conducted brokerage activity through Coinbase Wallet before making this move.”
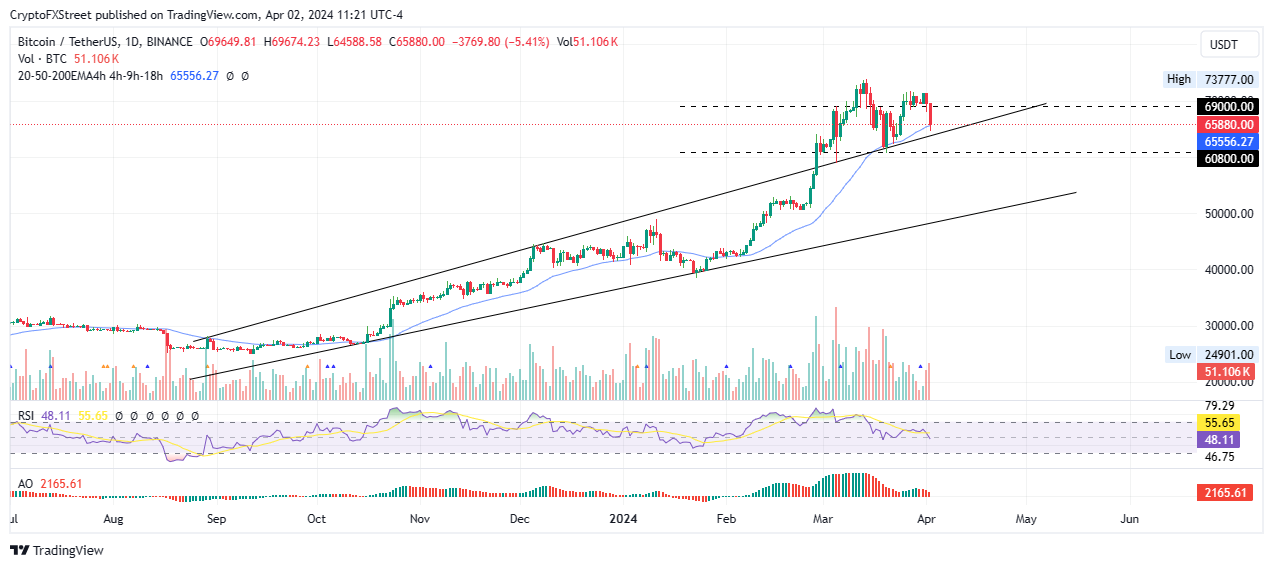
Bitcoin price outlook as BTC RSI dips below 50
Despite a prevailing bullish thesis on the big picture, the market is currently leaning in favor of the downside after the BTC RSI slipped below the 50 mean level. The Awesome Oscillator (AO) indicator is also accentuating what is seen with the RSI, pointing to falling momentum.
If Bitcoin price breaks support offered by the 200-day Exponential Moving Average (EMA) at $65,556, which has been critical since October, the fall could extend to the $60,800 level.
Notice the hidden bearish divergence on the BTC chart, seen with the RSI recording lower lows whilst the Bitcoin price records higher lows. This increases the chances for further downside if a full reversal emerges.

BTC/USDT 1-day chart
If the 200-day EMA holds as support, it would guarantee a rebound in Bitcoin price toward the upside. A flip of the $69,000 threshold into support would signal more buy orders, increasing the odds for further upside. The first target in such a directional bias would be to reclaim the $73,777 peak before a chance to record a new peak above the $74,000 range.


