- Bitcoin price is retesting its weekly resistance level of $67,147.
- Ethereum price finds support around $3,321, the price imbalance between $3,146 and $3,498.
- Ripple price faces rejection due to the key resistance level of $0.499.
Bitcoin (BTC) and Ripple (XRP) prices are poised for short-to-midterm corrections, while Ethereum (ETH) hints at a potential rally.
Bitcoin price faces resistance at a major level
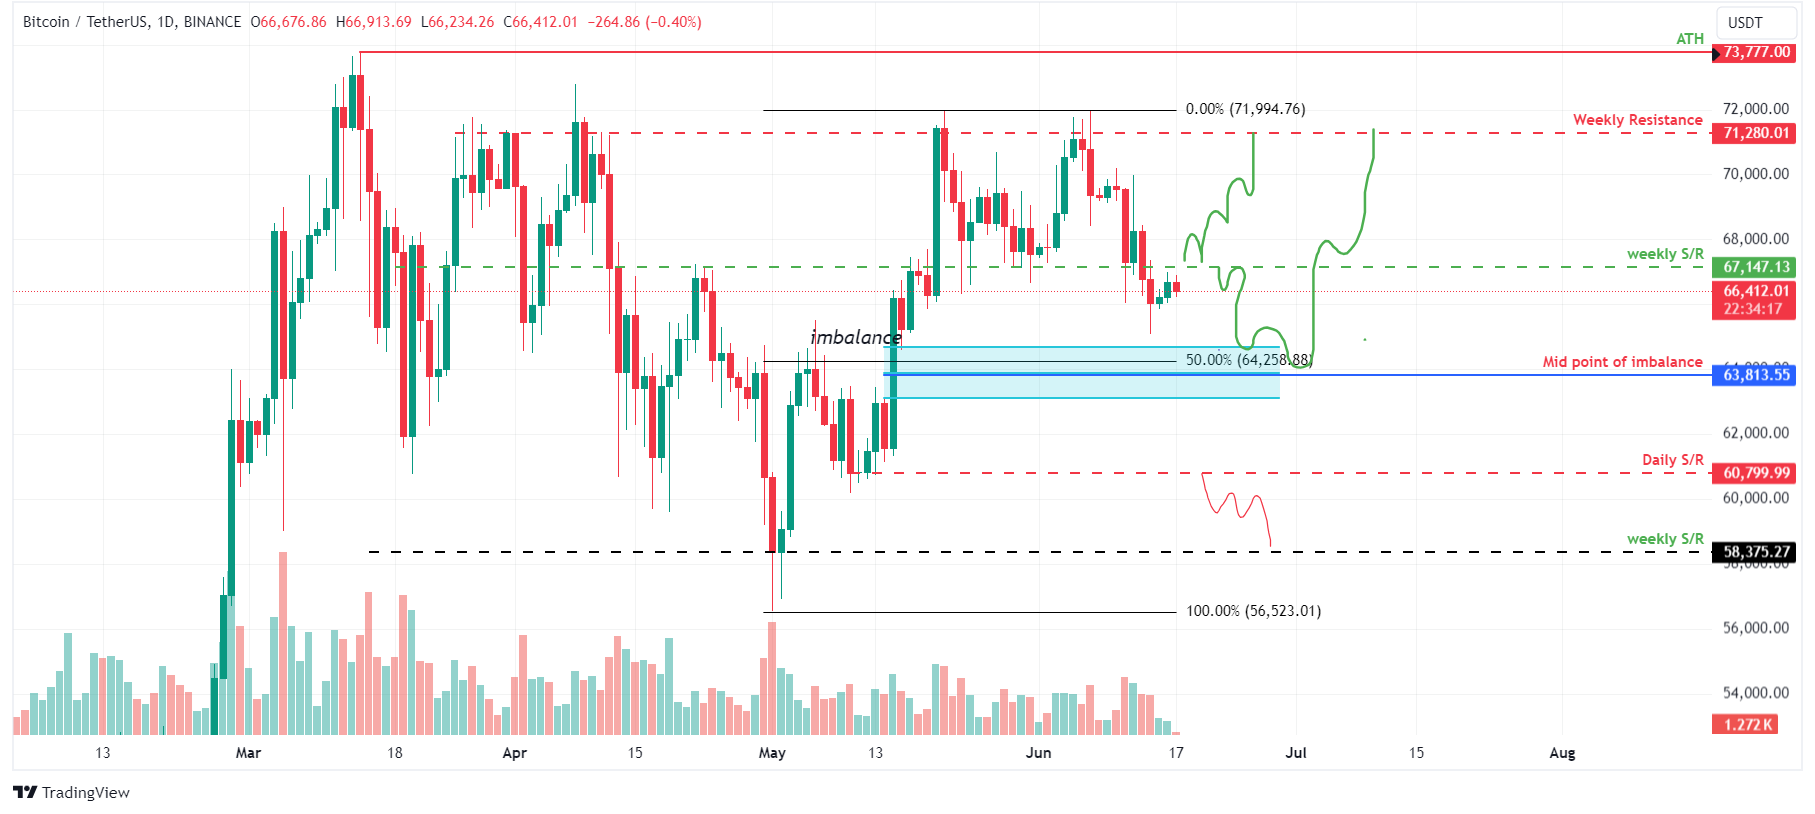
Bitcoin price daily candlestick closed at $66,043 on Friday and is currently moving upward toward its weekly resistance level of $67,147.
If BTC breaks above this weekly resistance level and flips it into a support zone, then it could rally 6% from the point of breakout to reach its previous resistance of $71,280.
However, if BTC fails to break above the $67,147 level, then it could have a short-to-midterm downward correction in the coming days, tagging the midpoint level of the price imbalance between $63,118 and $64,602 at $63,813.
This midpoint level also roughly coincides with the 50% retracement level at $64,258, calculated from the swing low of $56,523 on May 1 to a swing high of $71,994 on May 21.
If BTC bounces off $63,813, it could rally 6% to reach its previous resistance level of $67,147.
If the bulls are aggressive and the overall crypto market outlook is positive, then BTC could extend an additional rally of 6% to reach its previous resistance level of $71,280.

BTC/USDT 1-day chart
However, if Bitcoin price breaks and closes below its daily support level of $60,800, the bullish thesis would be invalidated, leading to a 4% drop to its weekly support level of $58,375.
Ethereum price poised for a rally
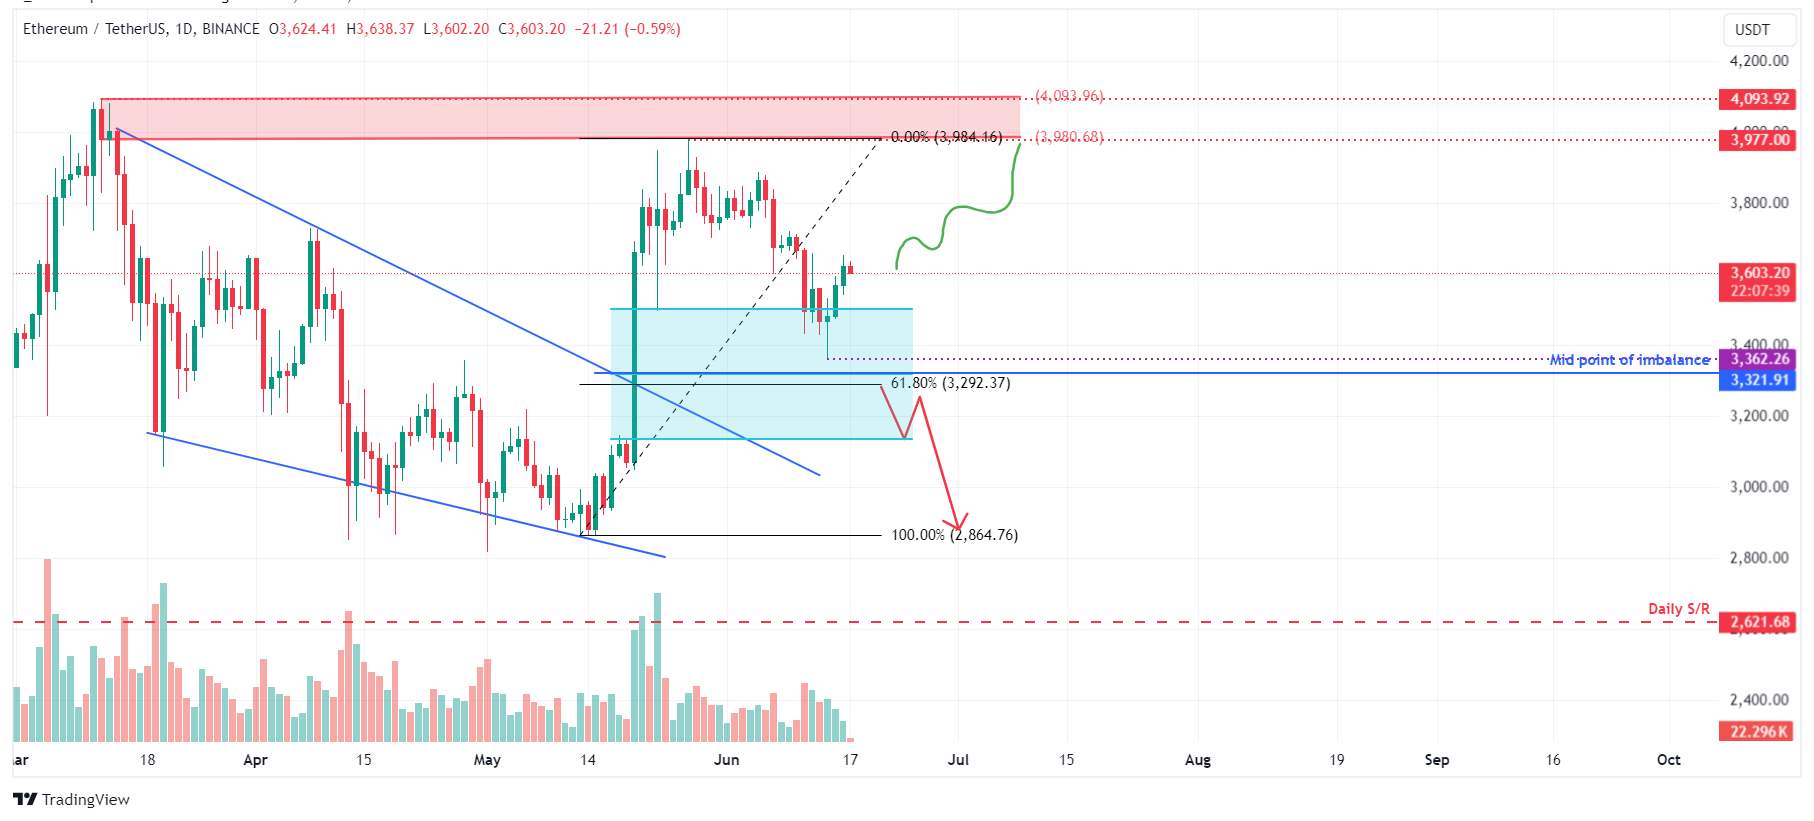
Ethereum price bounced 7% from a low of $3,362 on Friday to its current trading at $3,614.
The $3,362 level roughly hovers around the 61.8% Fibonacci retracement level and the price imbalance midpoint between $3,146 and $3,498.
If this support holds, ETH price could rally 10% from its current trading price of $3,614 to tag its previous resistance level of $3,977.

ETH/USDT 1-day chart
On the other hand, if Ethereum’s daily candlestick price closes below the $3,279 level, it would produce a lower low and signal a break in the market structure. This move would invalidate the aforementioned bullish thesis, potentially triggering an extra 13% crash to the previous support level of $2,864.
Ripple price is set for a correction
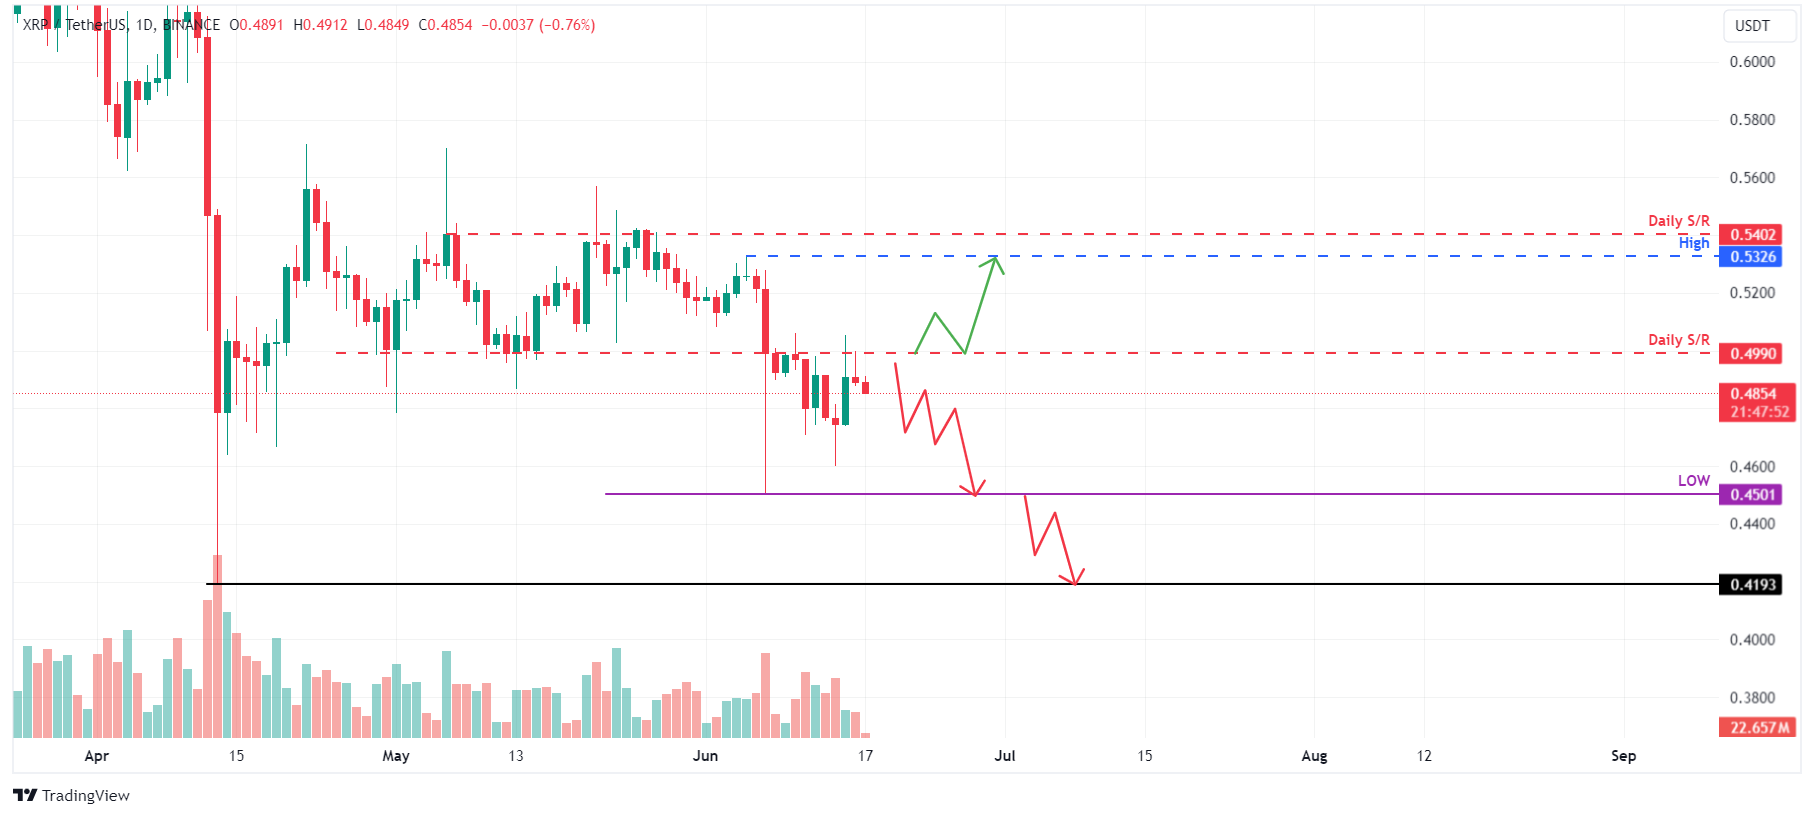
Ripple price faces resistance at its daily resistance level at $0.499.
If this resistance level holds, XRP could experience a 7% short-to-midterm downward correction from its current trading price of $0.488 to its recent low of $0.450.
If the bears are aggressive and the overall crypto market outlook is negative, then XRP could extend an additional decline of 7% to reach its previous low of $0.419 from April 13.

XRP/USDT 1-day chart
On the other hand, if the Ripple daily candlestick closes above $0.499, XRP could rally roughly 7% to its previous high of $0.532 on June 5.


