- Bitcoin price remains below $70,000, with current pullback likely to bottom out at $67,711.
- BTC hashrate has tripled as miners count roughly 21 days to fourth halving.
- Jim Cramer: “better sellers than buyers” as markets slide toward oversold on lower time frames.
Bitcoin (BTC) price is coming out of the weekend with a horizontal consolidation on higher time frames. However, lower time frames show more action as retail markets on Monday position themselves for the pre-halving rally.
Also Read: Week Ahead: Bitcoin flashes sell signal, but altcoins ignore it
Retail positions itself for pre-halving play
Bitcoin price dropped during the early hours of the New York session on Monday, bottoming out at $68,200. The move saw nearly $250 million in total liquidations across the market. It comes as the market walks into the Bitcoin halving month, with the event barely three weeks out.
Typically, pre-halving flush is 20 days from halving. Before that, however, markets tend to rally with tailwinds from FOMO and the ‘buy the rumor’ situation.
Standing at the ready, miners are also making deliberate moves as seen in the skyrocketing BTC hash rate. It means that the total computational power being used to mine Bitcoin has increased significantly, indicating that more miners are participating in the network.
According to CNBC Mad Money host Jim Cramer, sellers are better placed than buyers currently as BTC downside momentum looks likely. More closely, however, it is imperative to note that the April 1 sweep saw Bitcoin price take out the March 27 lows below $68,500. The onus is now on the bulls to keep holding above this range.
Open Interest, funding rate FAQs
Bitcoin price outlook as halving month kicks off
A reversal could push the market to $73,500, which is the next major resistance before the Bitcoin price can reclaim its $73,777 peak. Beyond this level would be a stronger bullish region between $74,000 and $75,000.
On the other hand, a decline below $68,500 would be a bearish sign for the short term, potentially sending Bitcoin price to $63,500, providing a buying opportunity for the late bulls before the halving.
Multiple technical indicators suggest the downtrend is still not over, likely until Bitcoin price tests the midline of the market range at $67,711, which coincides with the 50% Fibonacci placeholder. In a dire case, BTC could pivot around the 200-day Simple Moving Average (SMA) at $67,307.
The histograms of the Awesome Oscillator (AO) are dropping toward the zero line as the Relative Strength Index (RSI) nosedives to show falling momentum. These, coupled with the dwindling volume indicator suggests a weakening bullish trend.
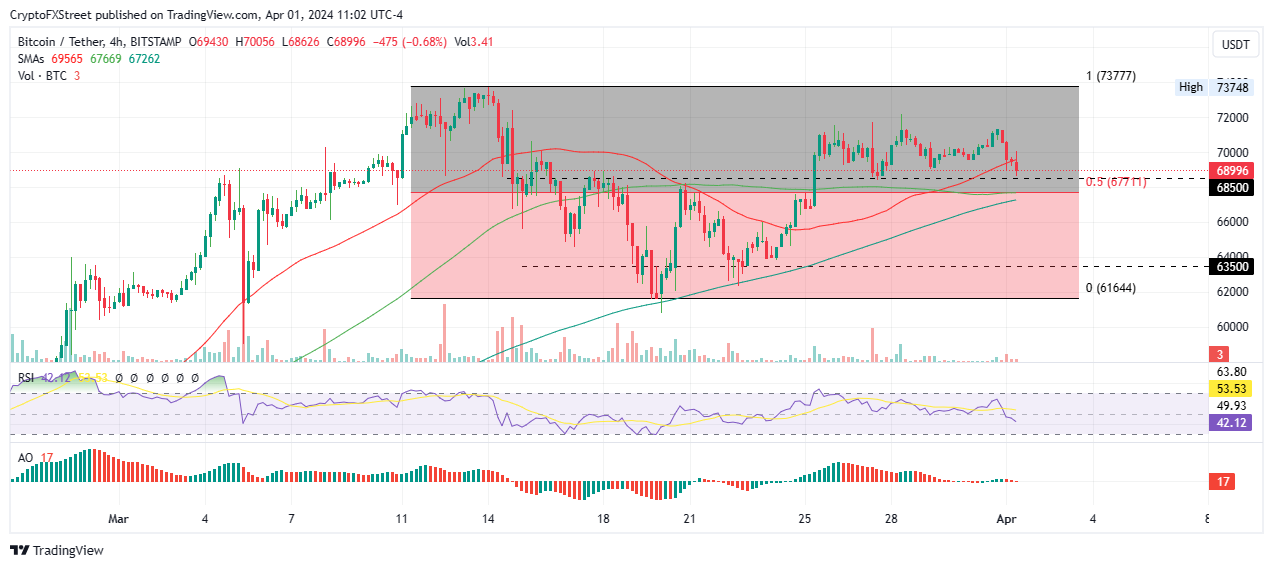
BTC/USDT 4-hour chart
Conversely, a reentry by the bulls could see Bitcoin price recover to overcome resistance due to the 50-day SMA at $69,565. Extended gains could set the pace for BTC price to reclaim above the $69,000 threshold.
A candlestick close above this landmark level would encourage more bulls to hit $73,500 before taking the $73,777 all-time high back. Such a move, denoting an 8% upswing, would set the tone for a higher peak above $74,000. A four-hour close above the range high would be the first step.