


- Bitcoin price successfully closes above the $66,000 resistance level, eyeing a rally ahead.
- Ethereum price bounces off its support level at $2,542, suggesting a possible rally ahead.
- Ripple price is nearing the 200-day EMA at $0.553; a close above suggests a possible recovery.
Bitcoin (BTC) and Ethereum (ETH) have established support at critical levels, signaling a potential rally. In contrast, Ripple’s (XRP) approach to its key resistance level hints that a successful breakout could lead to upward momentum in the coming days.
Bitcoin bulls show signs of strength
Bitcoin price broke above the $66,000 resistance level on Tuesday and rose 2.42% until Wednesday. At the time of writing on Thursday, it hovers around $67,600.
The Moving Average Convergence Divergence (MACD) indicator further supports Bitcoin’s rise after posting a bullish crossover on the daily chart on Monday. The MACD line (blue line) moved above the signal line (yellow line), giving a buy signal. It also shows rising green histogram bars above the neutral line of zero, suggesting increasing upward momentum.
Furthermore, the daily chart’s Relative Strength Index (RSI) shows that Bitcoin is nearing its overbought level. It trades at 67, close to the overbought level of 70. If it enters the zone on a closing basis, traders will be advised not to add to their long positions because the chances of a pullback would increase. Another possibility, however, is that the rally continues, and the RSI stays in the overbought zone. If it enters overbought and then exits back into the neutral level of 50, it will be a sign of a deeper correction.
If the $66,000 level holds as support, BTC would continue its ongoing rally to retest its July 29 high of $70,079.
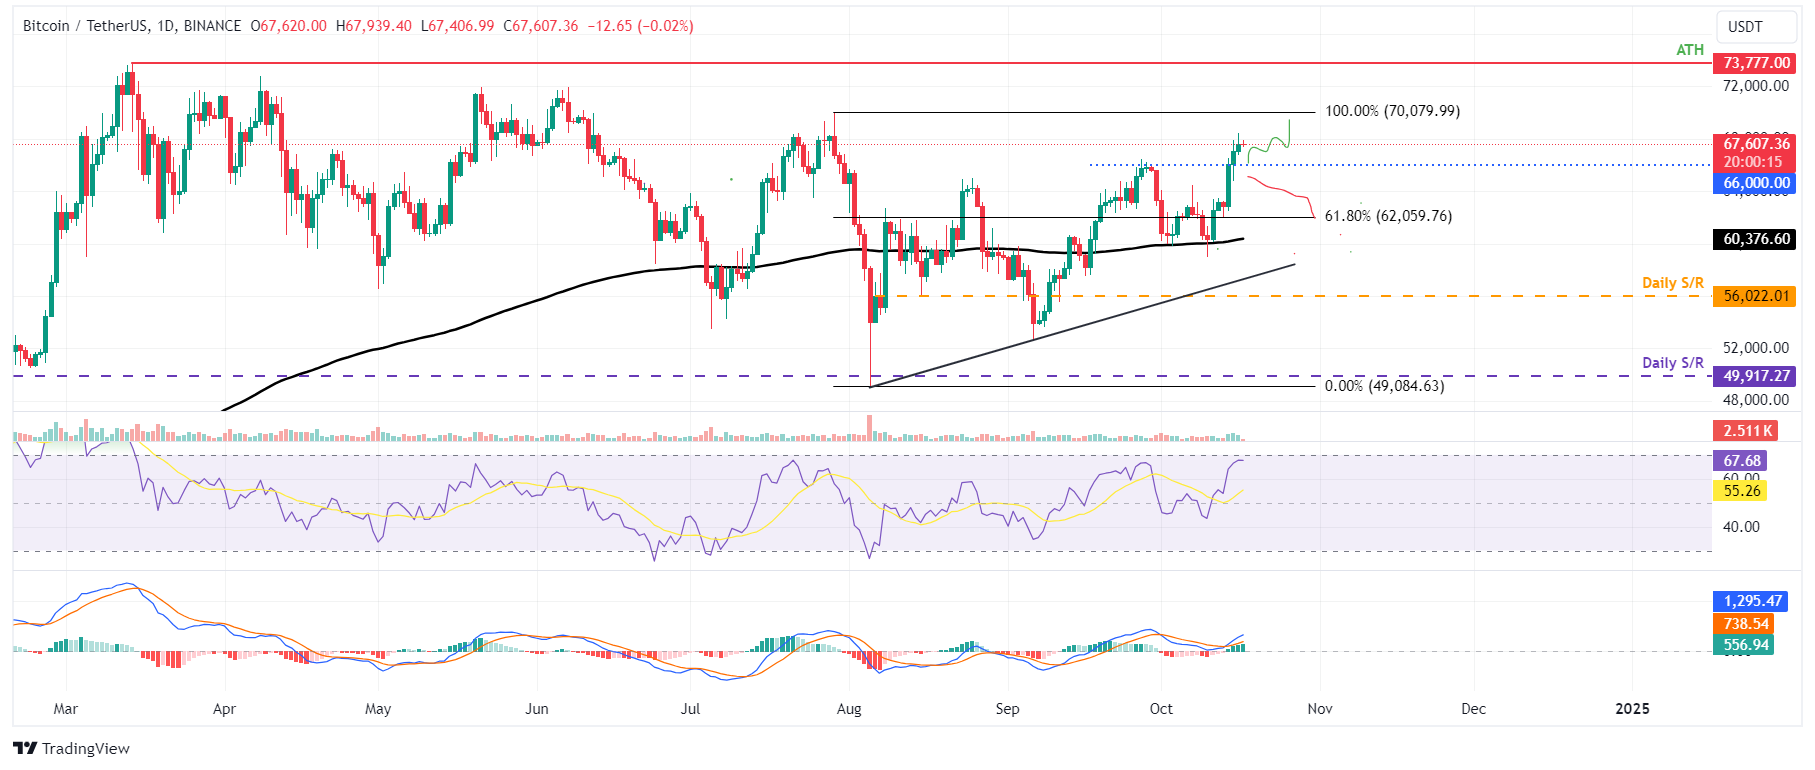
BTC/USDT daily chart
However, if BTC fails to find support around the $66,000 level and closes below it, Bitcoin could extend the decline by 6% and retest its $62,000 support level, which aligns with the 61.8% Fibonacci retracement level at $62,059 (drawn from July high of $70,079 to August low of $49,084).
Ethereum price shows potential for a rally
Ethereum price broke above the daily resistance level of $2,461 and rallied 6.5% on Monday, closing well above its 50-day Exponential Moving Average (EMA). On Tuesday, ETH declined to test and find support around the 50-day EMA at $2,542. At the time of writing on Thursday, ETH’s price edges higher and trades at around $2,600.
The MACD indicator supports Ethereum’s rise, signaling a bullish crossover on the daily chart. On Monday, the MACD line moved above the signal line, giving a buy signal. It shows rising green histogram bars above the neutral line zero, also suggesting that Ethereum’s price could experience upward momentum.
Additionally, the RSI on the daily chart trades at 61, above its neutral level of 50, suggesting bullish momentum is gaining traction.
If the 50-day EMA at $2,542 continues to hold as support, ETH could extend the rally to retest its August 24 high of $2,820.
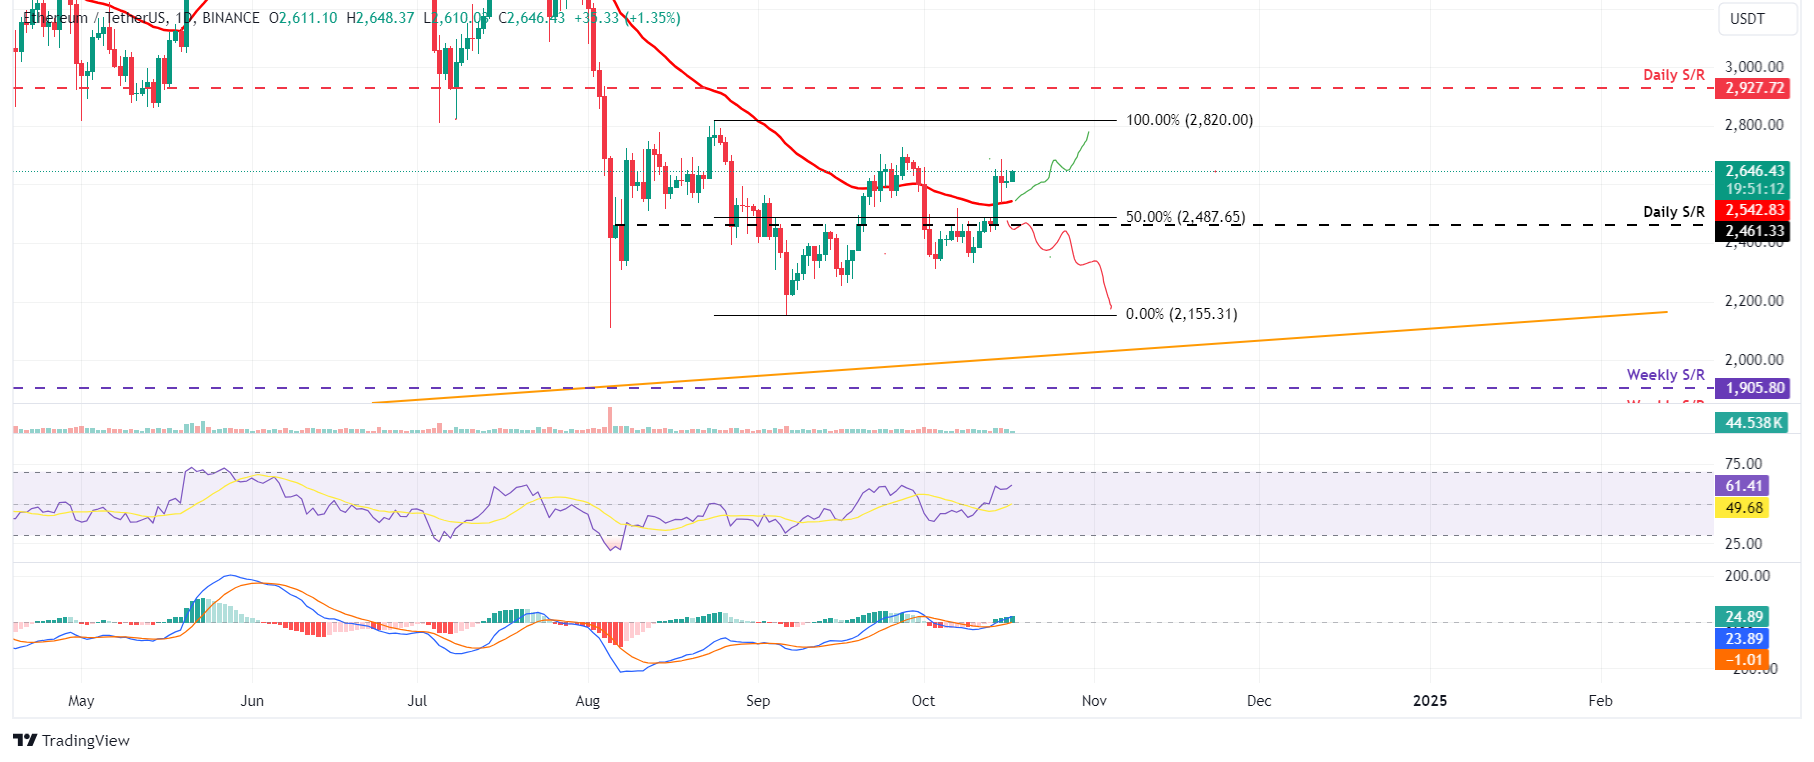
ETH/USDT daily chart
On the other hand, if Ethereum’s price closes below the daily support level at $2,461, ETH could extend the decline by 13% to retest its September 6 low of $2,150.
Ripple price could rally if it closes above its 200-day EMA
Ripple price has been rejected around its 200-day EMA at $0.553 multiple times since Monday. As of Thursday, it trades at around $0.551, nearing its 200-day EMA at $0.553.
If XRP breaks and closes above the 200-day EMA at $0.553, it could rally over 13% to retest its next daily resistance at $0.626.
The MACD indicator flipped a bullish crossover on the daily chart on Wednesday. The MACD line moved above the signal line, giving a buy signal. This suggests that bullish momentum is in control and could experience upward momentum.
Additionally, the RSI on the daily chart trades at 49, nearing its neutral level of 50. For the bullish momentum to gain traction, the RSI must trade above its neutral level.
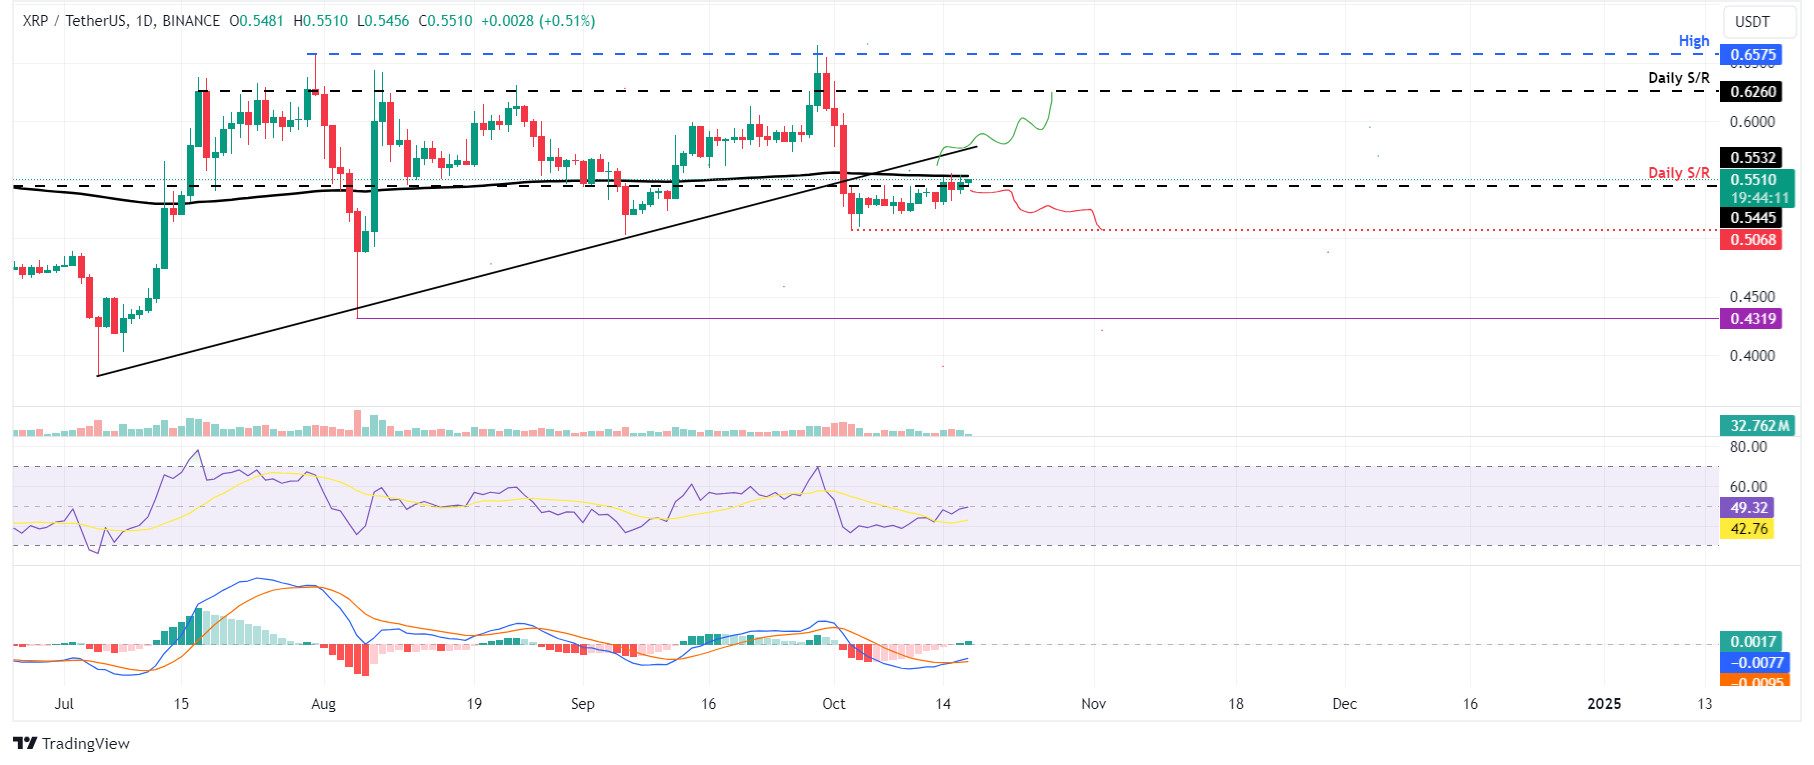
XRP/USDT daily chart
However, if the XRP price fails to close above the $0.553 level and closes below the daily resistance level at $0.544. This scenario could lead to a decline in the Ripple price to retest the October 3 low of $0.506.
Bitcoin, altcoins, stablecoins FAQs
Bitcoin is the largest cryptocurrency by market capitalization, a virtual currency designed to serve as money. This form of payment cannot be controlled by any one person, group, or entity, which eliminates the need for third-party participation during financial transactions.
Altcoins are any cryptocurrency apart from Bitcoin, but some also regard Ethereum as a non-altcoin because it is from these two cryptocurrencies that forking happens. If this is true, then Litecoin is the first altcoin, forked from the Bitcoin protocol and, therefore, an “improved” version of it.
Stablecoins are cryptocurrencies designed to have a stable price, with their value backed by a reserve of the asset it represents. To achieve this, the value of any one stablecoin is pegged to a commodity or financial instrument, such as the US Dollar (USD), with its supply regulated by an algorithm or demand. The main goal of stablecoins is to provide an on/off-ramp for investors willing to trade and invest in cryptocurrencies. Stablecoins also allow investors to store value since cryptocurrencies, in general, are subject to volatility.
Bitcoin dominance is the ratio of Bitcoin’s market capitalization to the total market capitalization of all cryptocurrencies combined. It provides a clear picture of Bitcoin’s interest among investors. A high BTC dominance typically happens before and during a bull run, in which investors resort to investing in relatively stable and high market capitalization cryptocurrency like Bitcoin. A drop in BTC dominance usually means that investors are moving their capital and/or profits to altcoins in a quest for higher returns, which usually triggers an explosion of altcoin rallies.