- Bitcoin price retests its key support level of $100K after rallying more than 7% in the previous week.
- Ethereum price finds support around its 200-day EMA at $3,125, eyeing a recovery ahead.
- Ripple price continues its rally on Monday after breaking above its symmetrical triangle pattern last week.
Bitcoin (BTC) and Ethereum (ETH) prices retest their key support level on Monday, with an eye on a rally ahead. At the same time, Ripple (XRP) continues its rally on Monday after breaking above its symmetrical triangle pattern last week.
Bitcoin price could resume rally if it holds above the $100K mark
Bitcoin price bounced after retesting its $90,000 support level at the start of the previous week and rallied 10.6% until Saturday. However, it faced rejection around the $106K level, declining 3.08% on Sunday, and retested its key support level at $100K. At the time of writing on Monday, it finds support around $100K and trades around $101,800.
If BTC’s $100K level holds as support, it could extend the rally to retest the December 17, 2024, all-time high of $108,353.
The Relative Strength Index (RSI) indicator on the daily chart reads 57, above its neutral level of 50, indicating a rise in bullish momentum. Additionally, the Moving Average Convergence Divergence (MACD) indicator flipped a bullish crossover on Wednesday, giving a buy signal and suggesting an uptrend.
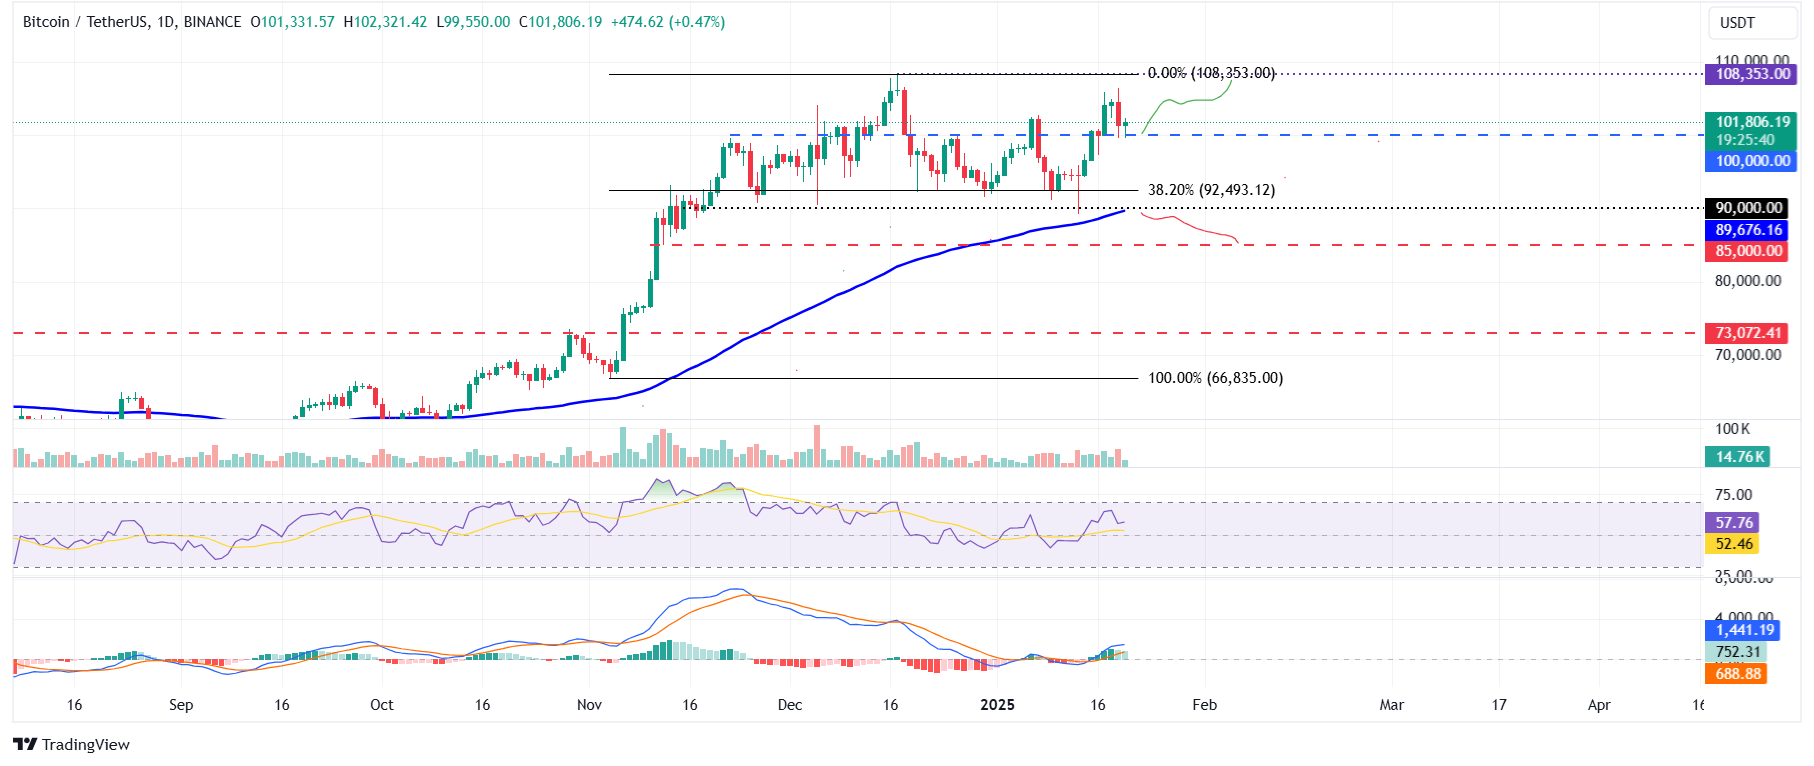
BTC/USDT daily chart
However, if BTC faces a pullback and closes below the $100,000 support level, it could extend the decline to retest its next support level at $90,000.
Ethereum price eyes for recovery above 200-day EMA
Ethereum price retests its 200-day Exponential Moving Average (EMA) at $3,125 on Sunday after declining more than 7% since the previous day. At the time of writing on Monday, it recovers slightly above around $3,276.
If the $3,125 EMA level holds, ETH could extend the recovery to test its daily resistance level at $3,730.
However, the RSI indicator on the daily chart reads 46, below its neutral level of 50, but points upwards, indicating weakness in bearish momentum. Additionally, the Moving Average Convergence Divergence (MACD) indicator is about to flip a bullish crossover. If the MACD line closes above the signal line, it would give a buy signal and suggest an uptrend.
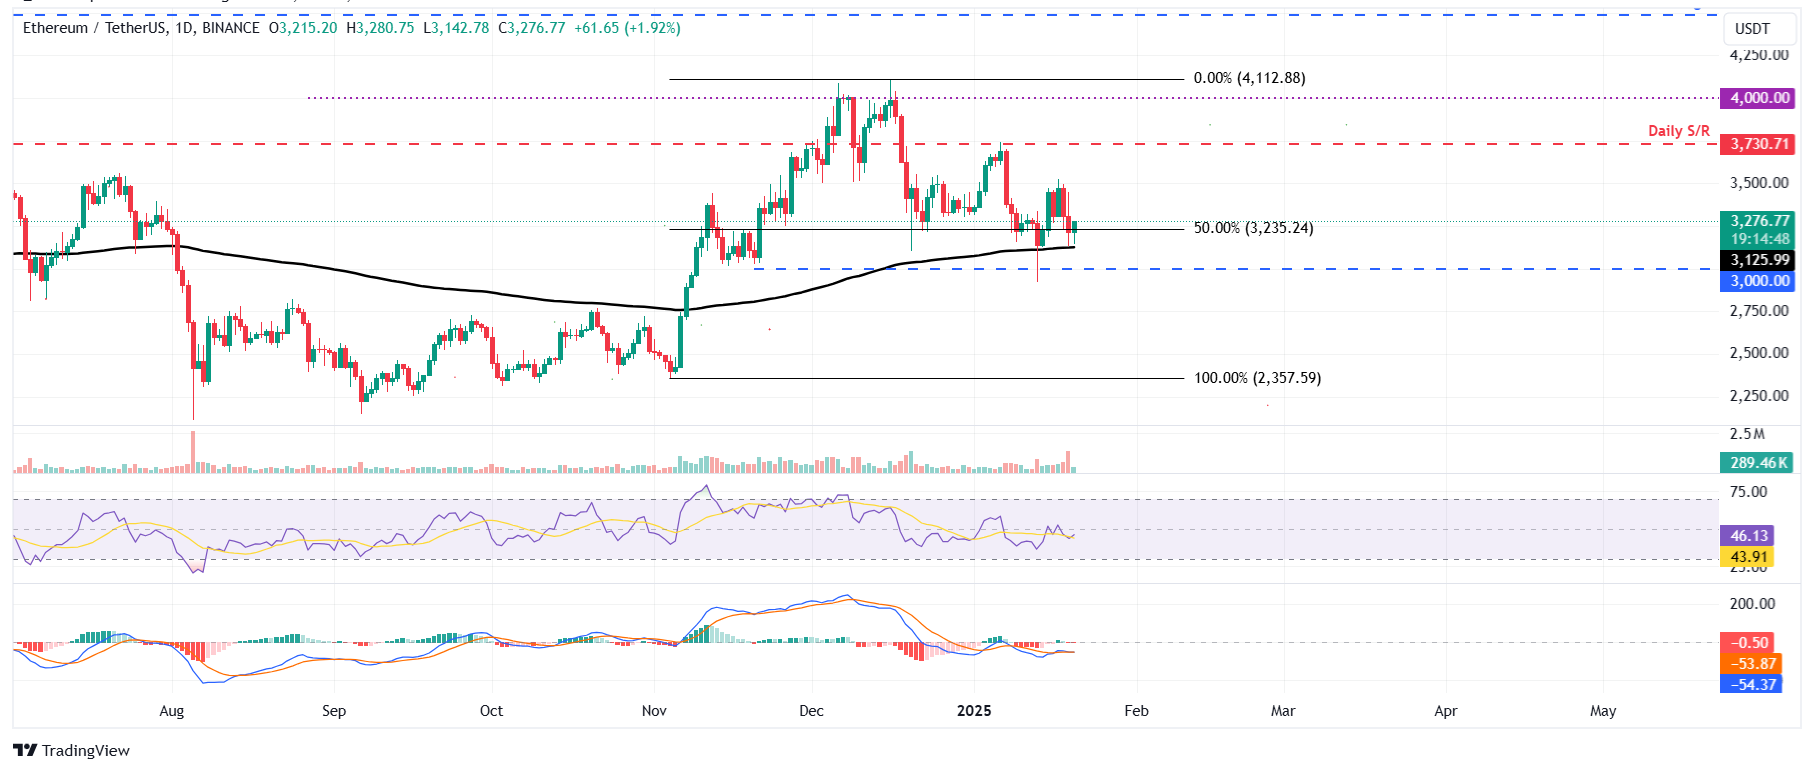
ETH/USDT daily chart
On the other hand, if ETH closes below the 200-day EMA at $3,125, it could extend the decline to test its psychological importance level of $3,000.
Ripple bulls could aim for the symmetrical triangle target at $3.63
Ripple price retested its upper symmetrical triangle boundary at the start of the previous week and rallied 30.48% until Friday. However, it faced rejection around the $3.30 level on Saturday and declined 10.14% until Sunday. At the time of writing on Monday, it trades slightly above around $3.13.
If XRP continues its upward momentum, it could extend the rally to test its technical target obtained by this pattern, which would be $3.63.
The RSI indicator reads 65, above its neutral value of 50 and points upwards, indicating bullish momentum. Additionally, the MACD shows a bullish crossover, suggesting a continuation of an upward trend.
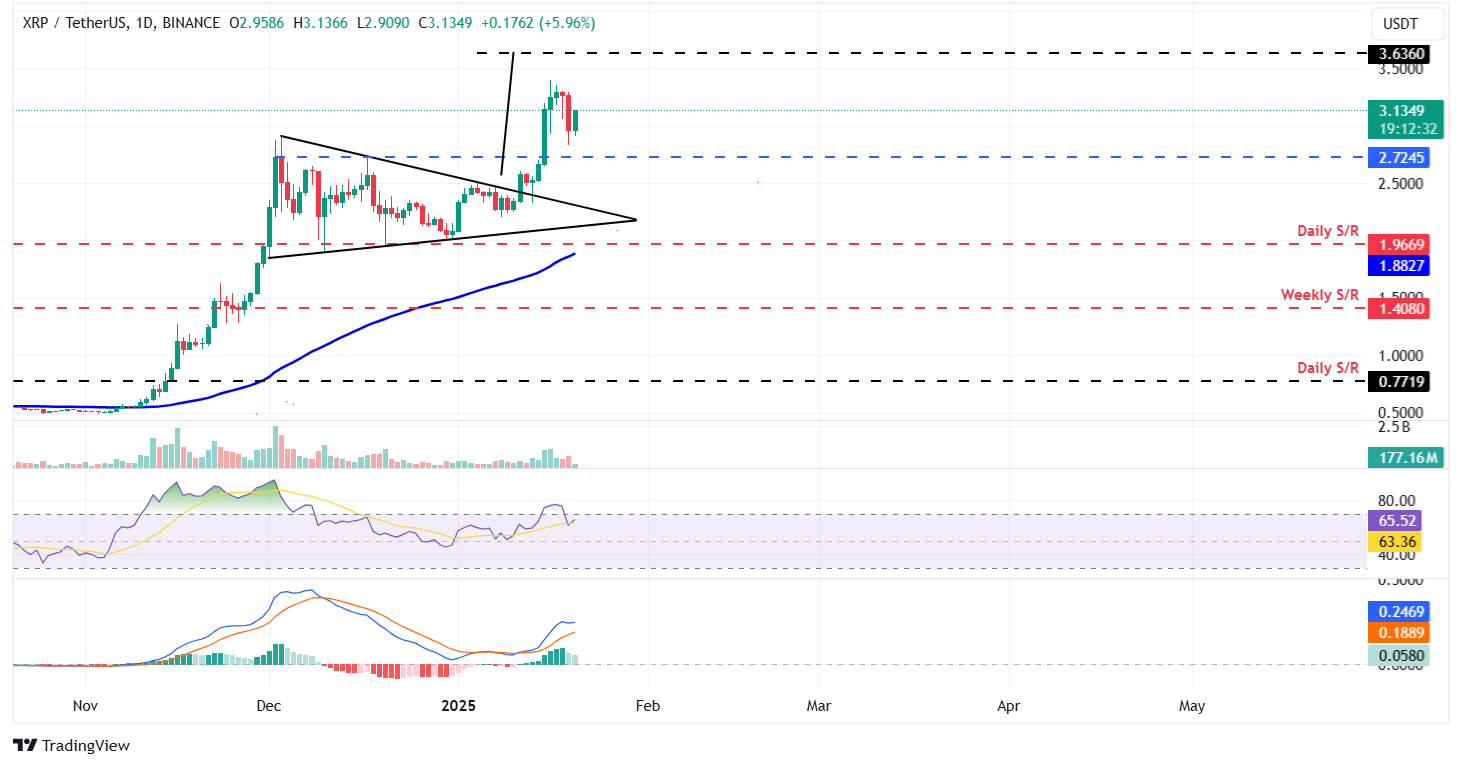
XRP/USDT daily chart
Conversely, if XRP closes below the $1.96 daily support level, it would extend the decline to retest its next support level at $1.40.
Bitcoin, altcoins, stablecoins FAQs
Bitcoin is the largest cryptocurrency by market capitalization, a virtual currency designed to serve as money. This form of payment cannot be controlled by any one person, group, or entity, which eliminates the need for third-party participation during financial transactions.
Altcoins are any cryptocurrency apart from Bitcoin, but some also regard Ethereum as a non-altcoin because it is from these two cryptocurrencies that forking happens. If this is true, then Litecoin is the first altcoin, forked from the Bitcoin protocol and, therefore, an “improved” version of it.
Stablecoins are cryptocurrencies designed to have a stable price, with their value backed by a reserve of the asset it represents. To achieve this, the value of any one stablecoin is pegged to a commodity or financial instrument, such as the US Dollar (USD), with its supply regulated by an algorithm or demand. The main goal of stablecoins is to provide an on/off-ramp for investors willing to trade and invest in cryptocurrencies. Stablecoins also allow investors to store value since cryptocurrencies, in general, are subject to volatility.
Bitcoin dominance is the ratio of Bitcoin’s market capitalization to the total market capitalization of all cryptocurrencies combined. It provides a clear picture of Bitcoin’s interest among investors. A high BTC dominance typically happens before and during a bull run, in which investors resort to investing in relatively stable and high market capitalization cryptocurrency like Bitcoin. A drop in BTC dominance usually means that investors are moving their capital and/or profits to altcoins in a quest for higher returns, which usually triggers an explosion of altcoin rallies.