- Bitcoin price stabilizes around $93,000 on Friday, following a 9.5% rally so far this week.
- Ethereum price faces resistance around the daily resistance level at $1,861; a breakout signals a potential rally.
- XRP approaches the $2.23 resistance; a close above this level indicates an uptrend ahead.
Bitcoin (BTC) price stabilizes around $93,000 at the time of writing on Friday, following a 9.5% rally so far this week. Ethereum (ETH) and Ripple (XRP) followed BTC’s move and rallied by 10% and 5%, respectively. However, these coins exhibit signs of bullish exhaustion on their momentum indicators, suggesting a potential pullback in the upcoming days.
Bitcoin bulls show signs of exhaustion
Bitcoin price broke above this resistance level on Monday, rising 10.45% to close above $93,000 on Thursday. However, BTC failed to close above its March high of $95,000. At the time of writing on Friday, it faces a mild correction and trades near $93,000.
If BTC continues its pullback, it could extend the decline to find support around the $90,000 psychological importance level.
The Relative Strength Index (RSI) on the daily chart reads 66 after being rejected around its overbought level of 70 on Thursday, indicating fading bullish momentum. If the RSI falls below its neutral level of 50, Bitcoin’s price could experience a sharp decline.
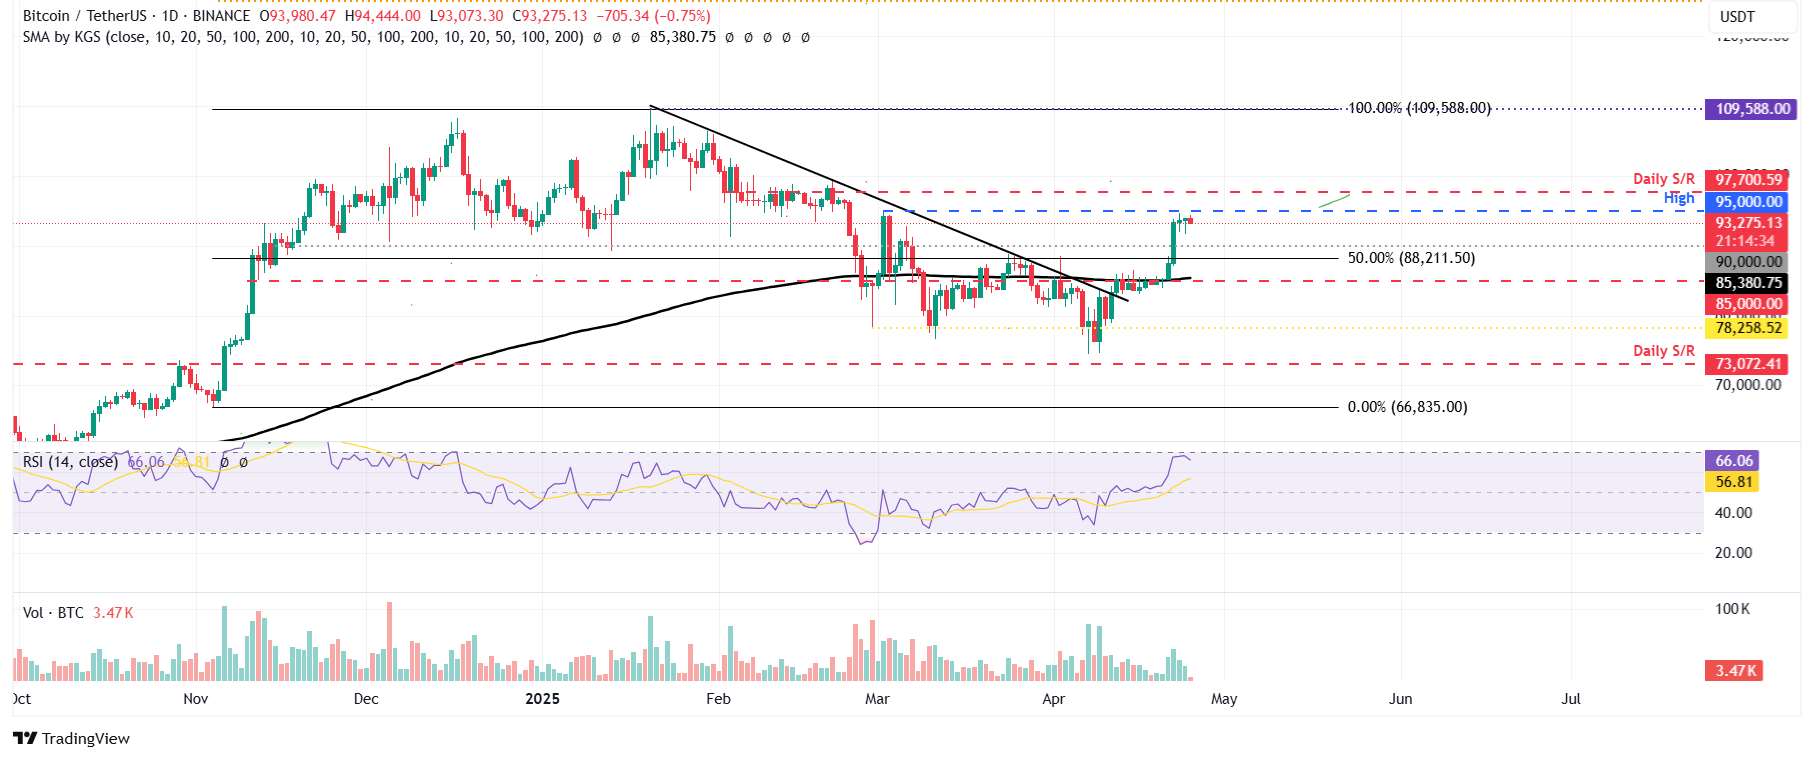
BTC/USDT daily chart
However, if BTC continues its upward momentum and closes above $95,000, it could extend the rally to retest its next daily resistance at $97,000.
Ethereum price faces resistance around $1,861
Ethereum price rallied 11.19% on Tuesday and closed above the $1,700 resistance level. It continued its gains the next day, reaching a high of $1,834, but failed to close above its daily resistance level at $1,861. ETH declined slightly on Thursday. At the time of writing on Friday, it continues to trade down around $1,750.
If ETH continues to face a pullback and closes below $1,700, it could extend the losses to retest its next daily support at $1,449.
The RSI on the daily chart stands at 52 and points downward toward its neutral level of 50, indicating fading bullish momentum. If the RSI falls below its neutral level of 50, Ethereum’s price could experience a sharp decline.
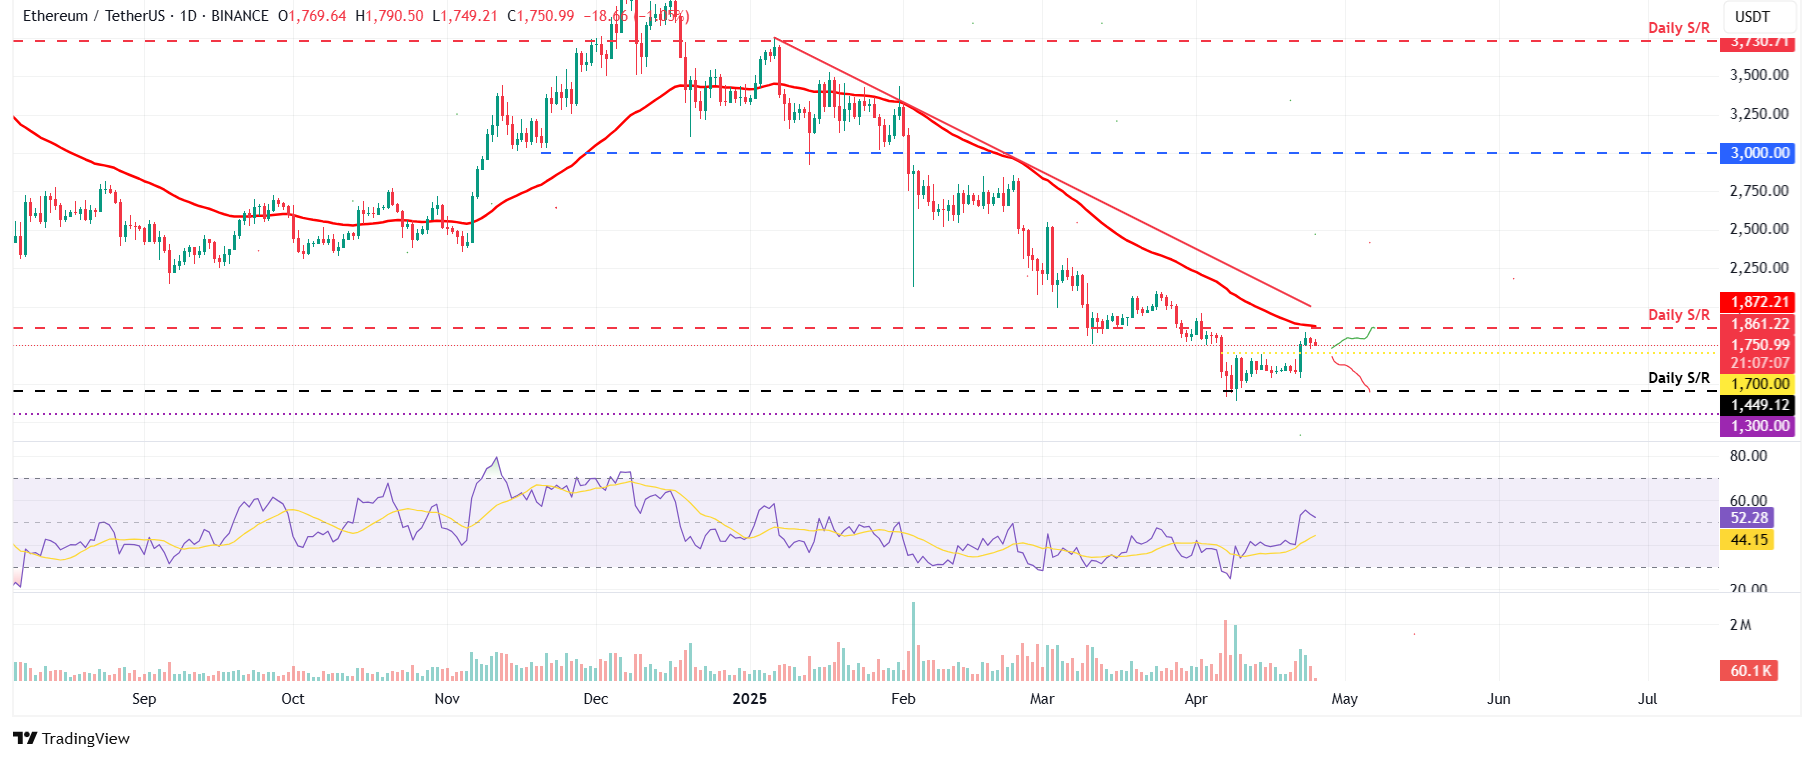
ETH/USDT daily chart
On the other hand, if ETH finds support around $1,700, it could extend the rally to retest its daily resistance at $1,861.
XRP declines as it faces rejection from its key resistance levels
XRP price failed to close above the daily resistance level at $2.23 on Wednesday and declined slightly the next day. This daily level coincided with the 50-day Exponential Moving Average at $2.19, making it a key resistance zone. At the time of writing on Friday, XRP is trading down at around $2.17.
If XRP continues its correction, it could extend the decline to retest its next support level at $1.96.
The RSI on the daily chart reads 52, and like Ethereum, it points downward toward its neutral level of 50, indicating fading bullish momentum. If the RSI falls below its neutral level of 50, the XRP price could experience a sharp decline.
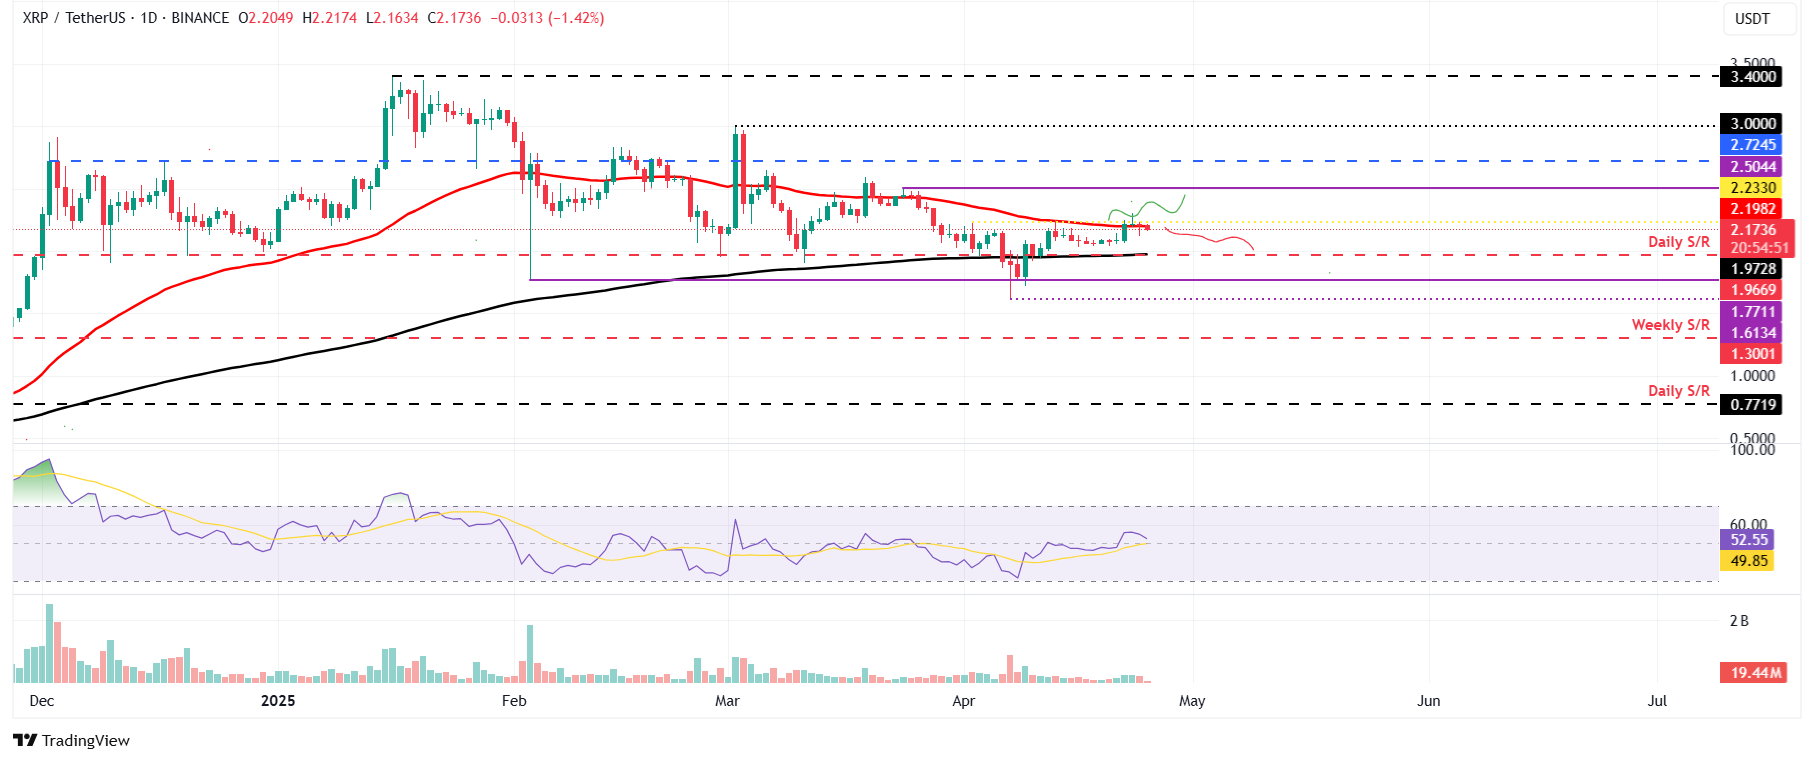
XRP/USDT daily chart
However, if XRP closes above its daily resistance level of $2.23, it will extend the rally to retest its March 24 high of $2.50 before potentially reaching $3.00.
Bitcoin, altcoins, stablecoins FAQs
Bitcoin is the largest cryptocurrency by market capitalization, a virtual currency designed to serve as money. This form of payment cannot be controlled by any one person, group, or entity, which eliminates the need for third-party participation during financial transactions.
Altcoins are any cryptocurrency apart from Bitcoin, but some also regard Ethereum as a non-altcoin because it is from these two cryptocurrencies that forking happens. If this is true, then Litecoin is the first altcoin, forked from the Bitcoin protocol and, therefore, an “improved” version of it.
Stablecoins are cryptocurrencies designed to have a stable price, with their value backed by a reserve of the asset it represents. To achieve this, the value of any one stablecoin is pegged to a commodity or financial instrument, such as the US Dollar (USD), with its supply regulated by an algorithm or demand. The main goal of stablecoins is to provide an on/off-ramp for investors willing to trade and invest in cryptocurrencies. Stablecoins also allow investors to store value since cryptocurrencies, in general, are subject to volatility.
Bitcoin dominance is the ratio of Bitcoin’s market capitalization to the total market capitalization of all cryptocurrencies combined. It provides a clear picture of Bitcoin’s interest among investors. A high BTC dominance typically happens before and during a bull run, in which investors resort to investing in relatively stable and high market capitalization cryptocurrency like Bitcoin. A drop in BTC dominance usually means that investors are moving their capital and/or profits to altcoins in a quest for higher returns, which usually triggers an explosion of altcoin rallies.