- Canadian Dollar eases against broader market.
- Canada absent from economic calendar on Monday.
- Canadian GDP slated for Tuesday ahead of key US labor figures.
The Canadian Dollar (CAD) is broadly softer on Monday, slipping back against most of its major currency peers and holding flat against the US Dollar (USD) in tepid trading. The economic calendar is thin to kick off the trading week as the US Federal Reserve (Fed) and another US Nonfarm Payrolls (NFP) on Friday loom ahead later in the week.
Canada’s latest monthly Gross Domestic Product (GDP) update is on Tuesday, but broader markets will be largely focused on the Fed’s upcoming rate call on Wednesday. US ADP Employment Change is also due Wednesday, and will serve as a preview (albeit a volatile one) to Friday’s US NFP jobs print.
Daily digest market movers: Thin data in US trading session leaves markets looking ahead
- Markets remain thin in the US market session, Canadian Dollar flattens against USD and Euro (EUR).
- Suspected intervention in global markets by the Bank of Japan (BoJ) on behalf of Japanese Yen (JPY) roiled Pacific markets, leaving a volatility vacuum in its wake.
- Tuesday’s Canadian MoM GDP is expected to decline to 0.3% in February after January’s 12-month high of 0.6%.
- Bank of Canada (BoC) Governor Tiff Macklem will be testifying alongside Senior Deputy Governor Carolyn Rogers before the Canadian government’s Standing Senate Committee on Banking, Commerce, and the Economy on Wednesday.
- BoC’s reporting is widely expected to get drowned out by markets focusing on Fed’s latest rate call, also scheduled on Wednesday.
- According to the CME’s FedWatch Tool, rate markets currently see around 58% odds of first rate cut in September.
Canadian Dollar price today
The table below shows the percentage change of Canadian Dollar (CAD) against listed major currencies today. Canadian Dollar was the strongest against the US Dollar.
| USD | EUR | GBP | CAD | AUD | JPY | NZD | CHF | |
| USD | -0.18% | -0.46% | -0.05% | -0.44% | -1.62% | -0.54% | -0.45% | |
| EUR | 0.18% | -0.28% | 0.13% | -0.24% | -1.40% | -0.35% | -0.26% | |
| GBP | 0.47% | 0.27% | 0.41% | 0.03% | -1.11% | -0.09% | 0.03% | |
| CAD | 0.04% | -0.15% | -0.41% | -0.38% | -1.53% | -0.50% | -0.42% | |
| AUD | 0.42% | 0.24% | -0.04% | 0.40% | -1.15% | -0.12% | -0.02% | |
| JPY | 1.55% | 1.35% | 1.08% | 1.53% | 1.10% | 0.99% | 1.13% | |
| NZD | 0.53% | 0.35% | 0.08% | 0.50% | 0.12% | -1.03% | 0.10% | |
| CHF | 0.46% | 0.28% | -0.01% | 0.40% | 0.03% | -1.14% | -0.09% |
The heat map shows percentage changes of major currencies against each other. The base currency is picked from the left column, while the quote currency is picked from the top row. For example, if you pick the Euro from the left column and move along the horizontal line to the Japanese Yen, the percentage change displayed in the box will represent EUR (base)/JPY (quote).
Technical analysis: Canadian Dollar flattens as markets look elsewhere
During Monday’s US market session, the Canadian Dollar (CAD) treads water, trading close to a tenth of a percent against both the US Dollar and the Euro (EUR). The CAD is down around half of a percent against the Antipodeans and in the red over a full percent plus a third against the JPY.
USD/CAD continues to churn into the 1.3650 technical level. The pair continues to slip back from last week’s peak bids near 1.3850, but intraday bids still stick on the high side of a near-term supply zone between 1.3600 and 1.3550.
Despite a near-term pullback, the USD/CAD remains on the bullish side of long-term technicals. The pair still holds north of the 200-day Exponential Moving Average (EMA) at 1.3528, and the US Dollar is still up around 3% against the Canadian Dollar in 2024.
USD/CAD hourly chart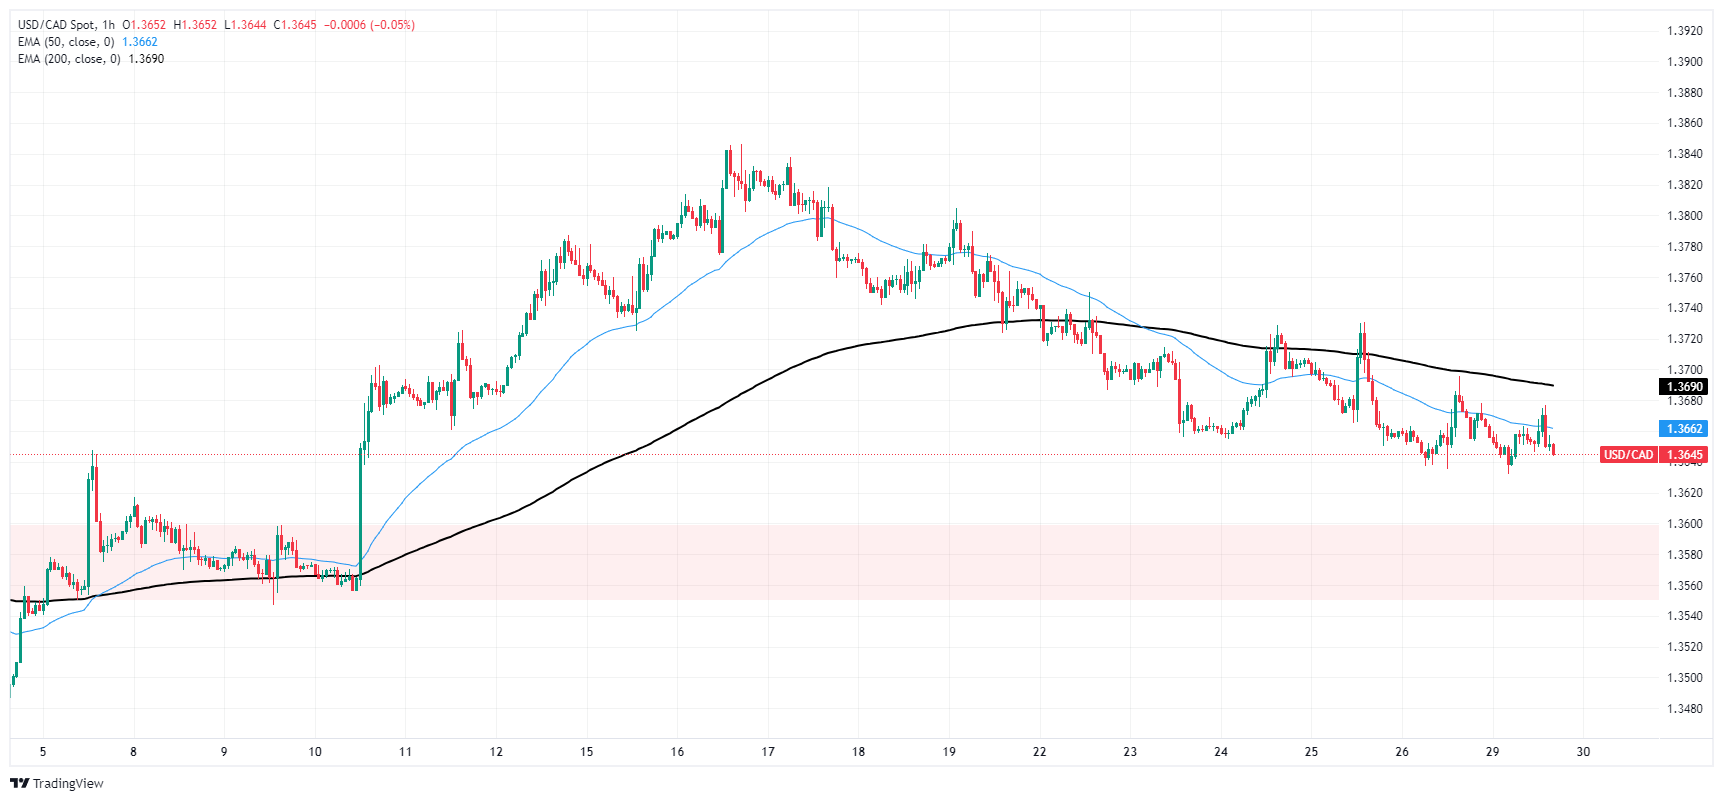
USD/CAD daily chart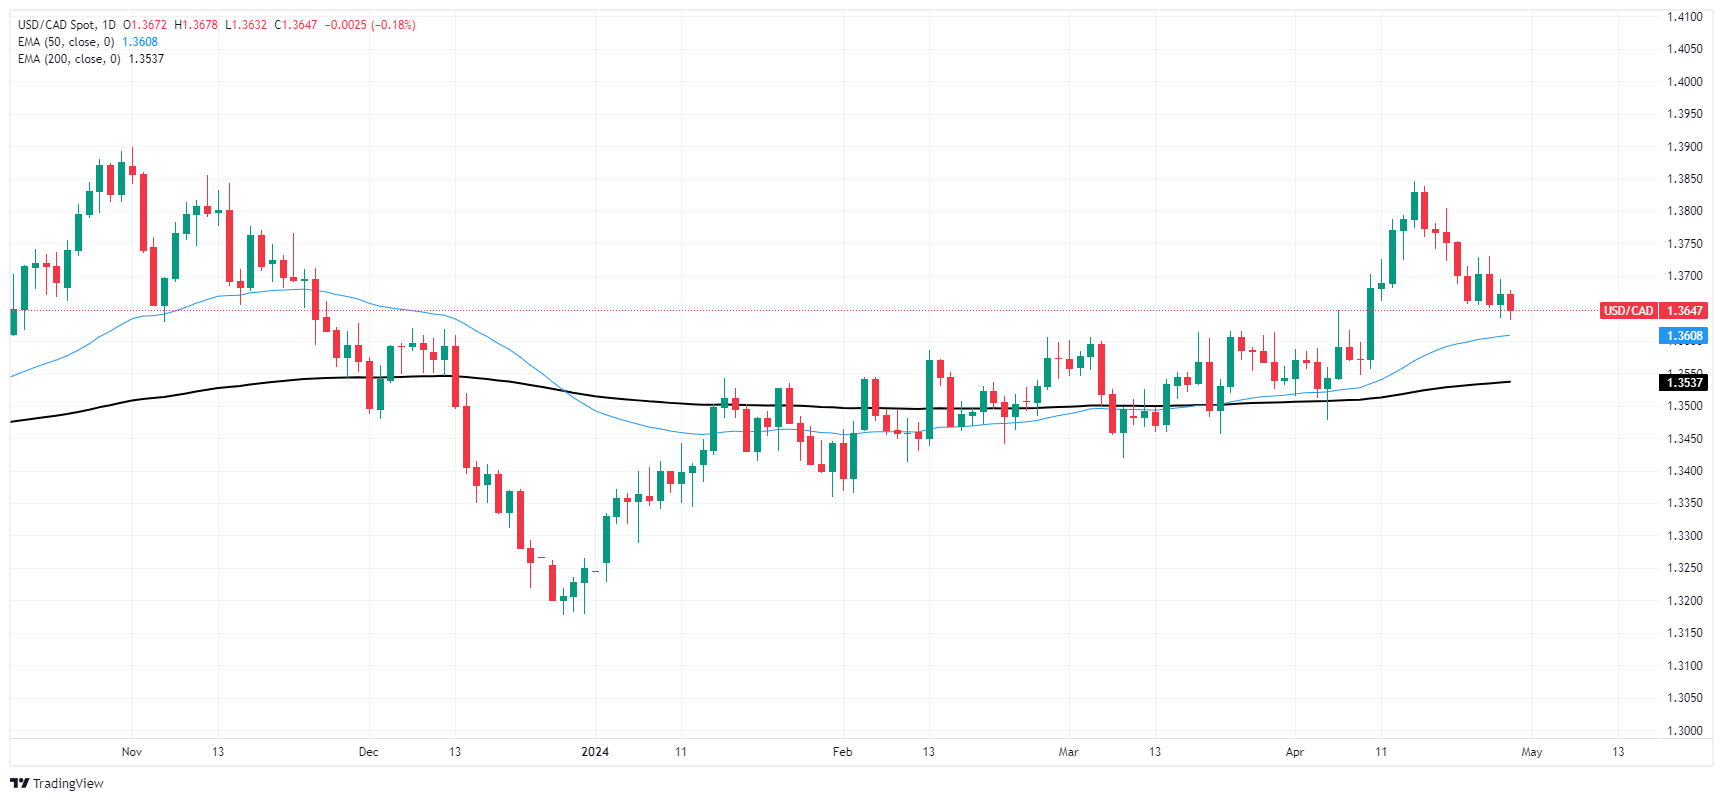
GDP FAQs
A country’s Gross Domestic Product (GDP) measures the rate of growth of its economy over a given period of time, usually a quarter. The most reliable figures are those that compare GDP to the previous quarter e.g Q2 of 2023 vs Q1 of 2023, or to the same period in the previous year, e.g Q2 of 2023 vs Q2 of 2022. Annualized quarterly GDP figures extrapolate the growth rate of the quarter as if it were constant for the rest of the year. These can be misleading, however, if temporary shocks impact growth in one quarter but are unlikely to last all year – such as happened in the first quarter of 2020 at the outbreak of the covid pandemic, when growth plummeted.
A higher GDP result is generally positive for a nation’s currency as it reflects a growing economy, which is more likely to produce goods and services that can be exported, as well as attracting higher foreign investment. By the same token, when GDP falls it is usually negative for the currency. When an economy grows people tend to spend more, which leads to inflation. The country’s central bank then has to put up interest rates to combat the inflation with the side effect of attracting more capital inflows from global investors, thus helping the local currency appreciate.
When an economy grows and GDP is rising, people tend to spend more which leads to inflation. The country’s central bank then has to put up interest rates to combat the inflation. Higher interest rates are negative for Gold because they increase the opportunity-cost of holding Gold versus placing the money in a cash deposit account. Therefore, a higher GDP growth rate is usually a bearish factor for Gold price.