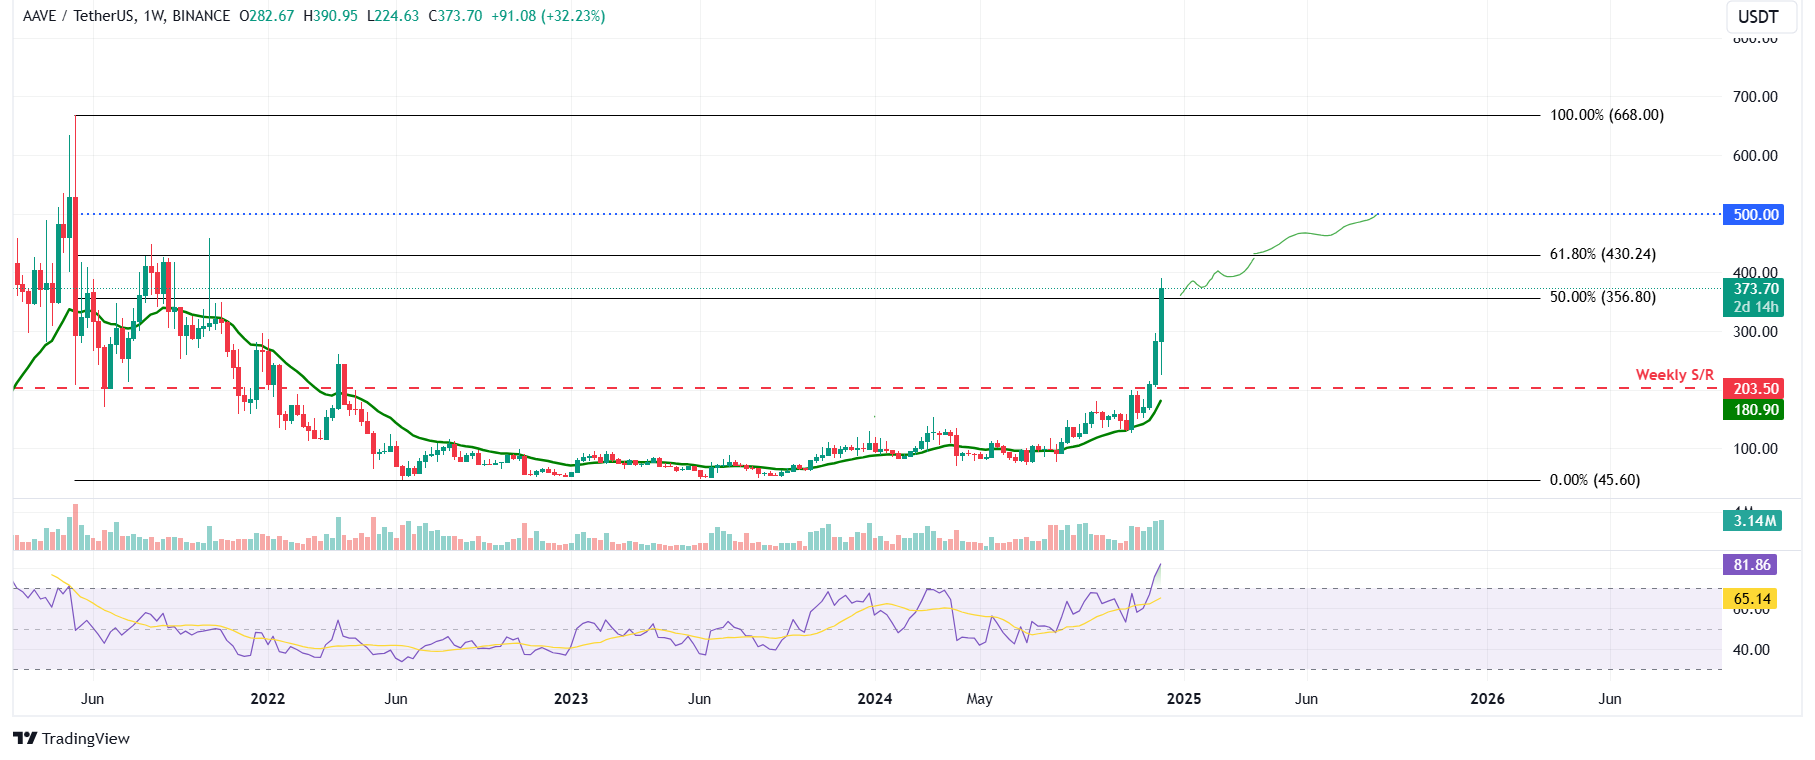
- Aave price extends gains, trading above $370 on Friday, after rallying more than 30% so for this week.
- On-chain data supports a continuation of the rally as AAVE daily trading volume, active addresses and TVL reach record levels.
- Other signs of optimism are the continued purchase of AAVE tokens by the Trump-backed DeFi platform.
- The technical outlook suggests further gains ahead, targeting $500.
Aave (AAVE) price extends its gains, trading above $370 on Friday after rallying more than 30% this week. AAVE on-chain metrics supported this rise as its trading volume, active addresses, and Total Value Locked (TVL) have reached record levels.
Some other signs adding to the bullish outlook were token purchases by a Trump-backed DeFi platform and the behavior of whales. In this context, the technical outlook suggests a potential climb toward the $500 psychological level.
AAVE on-chain metrics remain bullish
Aave price has rallied more than 30% this week, surging almost 80% so far in December. This recent rise has led AAVE’s current market capitalization to reach $5.48 billion, according to CoinGecko.
Looking down into its on-chain metrics supports this price rally. Data from crypto intelligence tracker DefiLlama data shows AAVE’s TVL increased from $13.77 billion on November 1 to $23.46 billion on Friday, the highest since its launch in November 2017.
This increase in TVL indicates growing activity and interest within the Aave ecosystem because it shows that more users deposit or utilize assets within AAVE-based protocols.

AAVE TVL chart. Source: DefiLlama
Santiment’s active addresses data, which track network activity over time, rose from 1,635 on Wednesday to 5,079 on Thursday, the highest level since June 25, 2023. This indicates that demand for AAVE’s blockchain usage is increasing.
%20%5B12.14.54,%2013%20Dec,%202024%5D-638696860705228316.png)
AAVE daily active addresses chart. Source: Santiment
Another aspect bolstering the platform’s bullish outlook is the recent surge in traders’ interest and liquidity in the Aave’s chain. Santiment data shows AAVE’s daily trading volume reached $2.36 billion on Thursday, the highest level since October 28, 2021.
%20%5B12.20.00,%2013%20Dec,%202024%5D-638696861102020036.png)
AAVE daily trading volume chart. Source: Santiment.
Technical Outlook: Looking at $500
Aave, which trades around $370 at the time of writing, has broken above the 50% price retracement level at $356.80, drawn from the all-time high of $668 on May 18, 2021, to the June 2022 low of $45.60.
If AAVE continues the upward trend and closes above $356.80, it could extend the rally to retest the next resistance at the 61.8% Fibonacci retracement level at $430.24. A successful close above this level could extend the rally to retest its psychologically important and round level of $500.
However, the Relative Strength Index (RSI) on the weekly chart reads at 81, signaling extremely overbought conditions and suggesting an increasing risk of a correction. Traders should be cautious when adding to their long positions because the chances of a price pullback are increasing.
Still, the RSI is quite stable and pointing upwards, so there is also the possibility that the rally continues and the indicator edges further up or remains within the overbought level. A clear sell signal would occur if the RSI decisively exited overbought territory.

AAVE/USDT weekly chart
Some other optimistic signs for AAVE
Besides the technical outlook and on-chain metrics, other elements also support the bullish thesis. According to Lookonchain data, Trump-backed DeFi platform World Liberty Financial (WFLI) multisig wallet had spent $1 million to buy 3,357 AAVE tokens on Thursday. WFLI further added $246.7K worth of AAVE on Friday.
Moreover, during the same period, asset management company Galaxy Digital withdrew from exchanges 27,722 AAVE worth $10.19 million.


