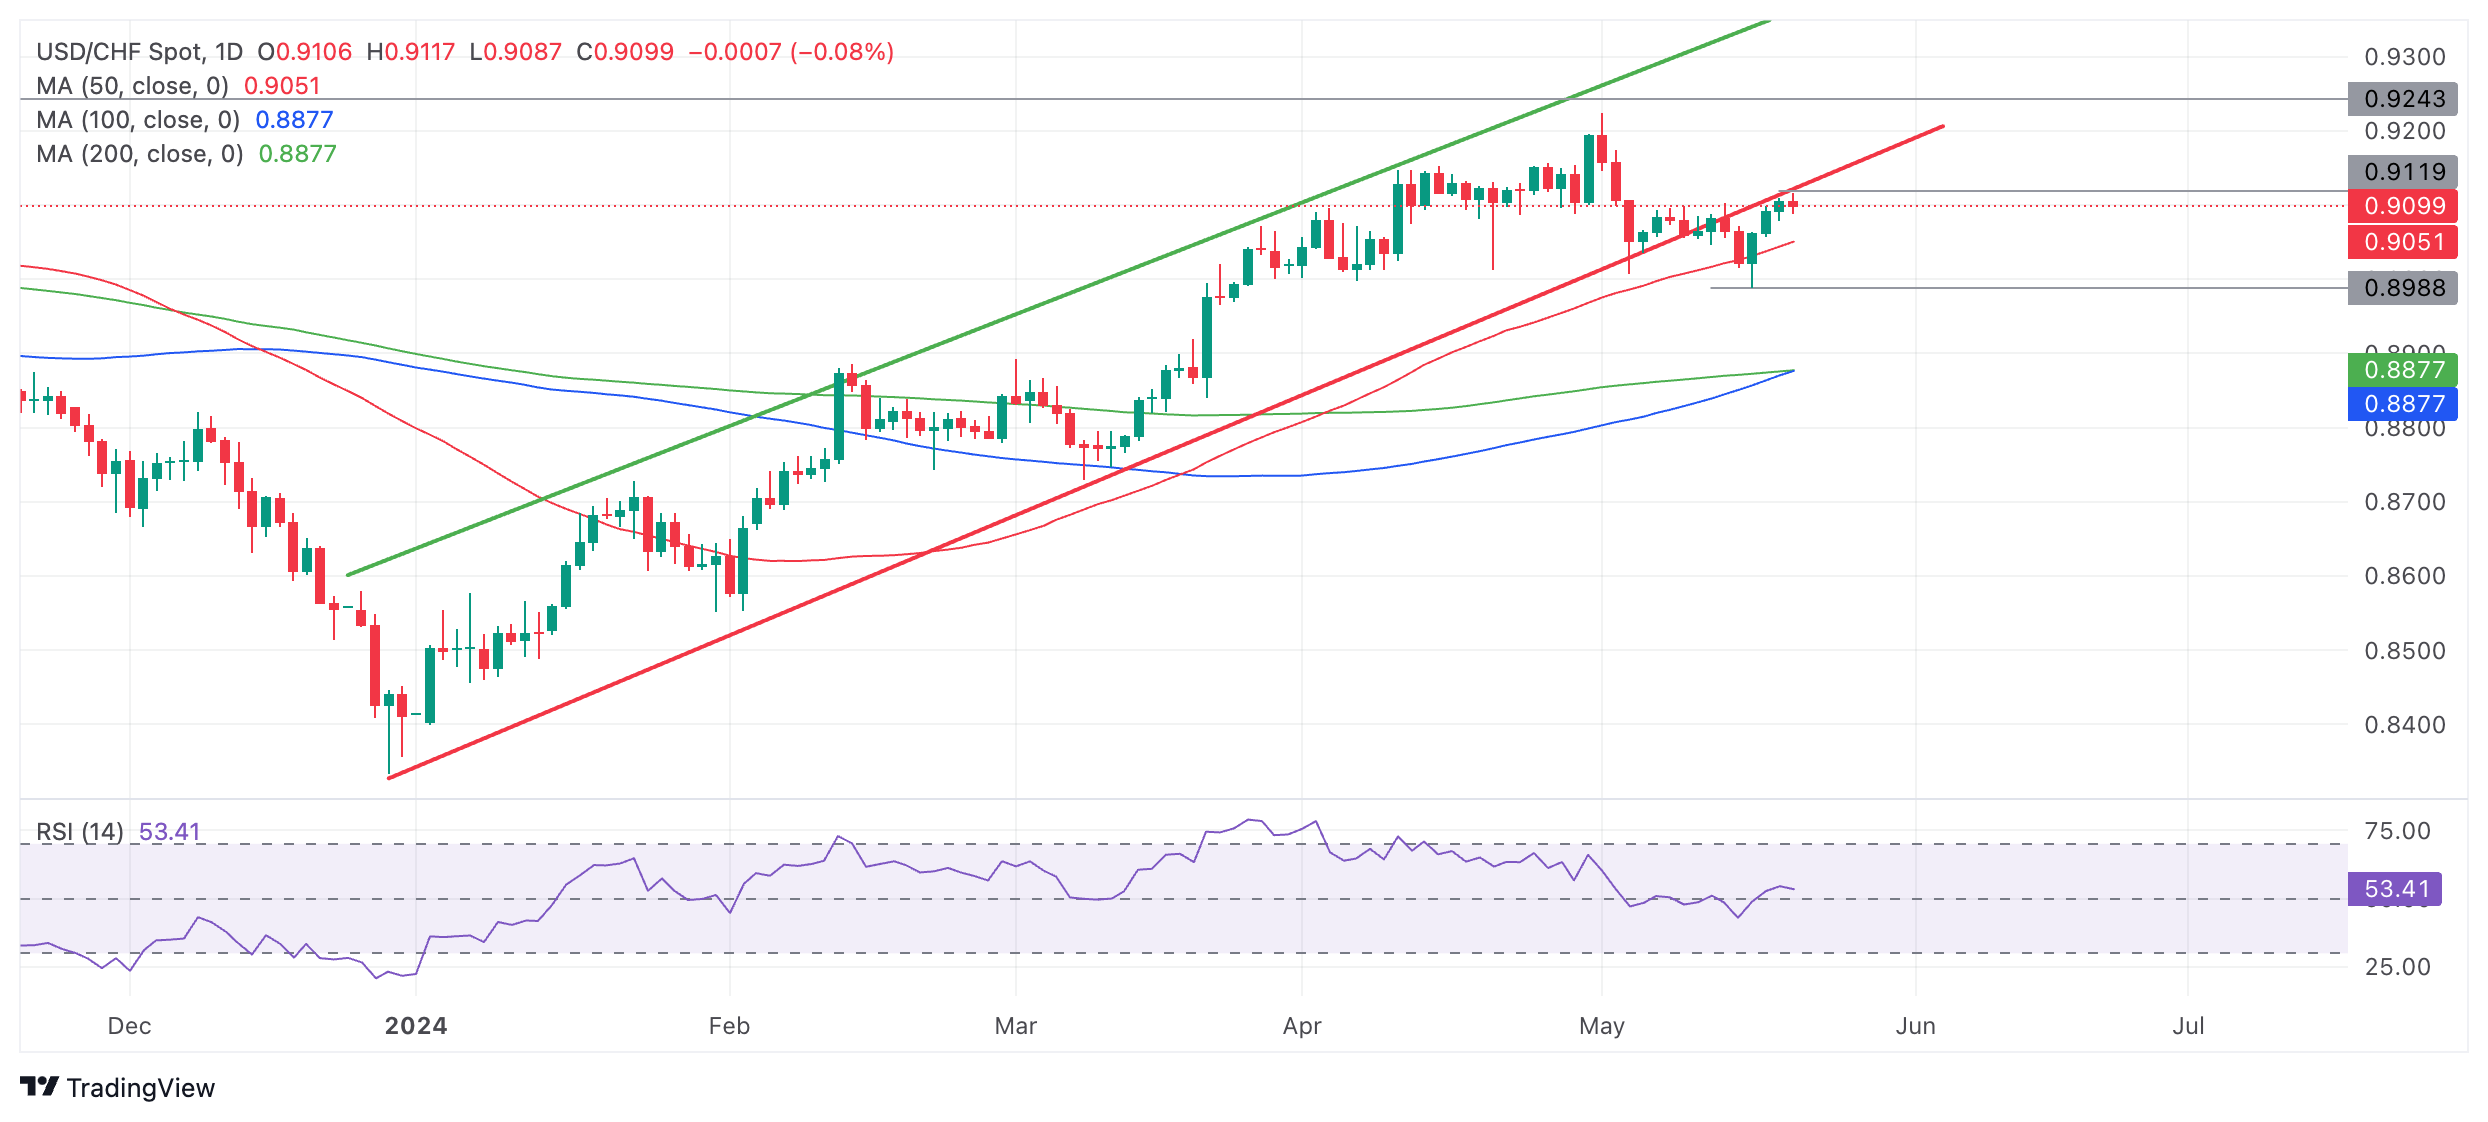
- USD/CHF has been in a rising channel all year with a bullish bias.
- A break below the base of the channel on May 14 brought into doubt the uptrend.
- The pair is now at a critical point – further weakness confirms a reversal; strength a continuation back inside the channel.
USD/CHF is at a critical crossroads in its technical development. Whilst the uptrend remains intact the pair is vulnerable to a reversal if more weakness results in a significant downside move.
USD/CHF Daily Chart

The pair has been rising in a channel since the start of 2024. It is in an uptrend on the daily chart, the time frame used to assess the medium-term trend. Given the received wisdom that “the trend is your friend” the uptrend should continue.
Short term the outlook is less clear since price broke on a closing basis below the red lower borderline of the ascending channel on May 14. It is now debatable whether the short-term uptrend is still intact or whether a new bearish trend is developed.
After the trendline break USD/CHF fell to a low of 0.8988 on May 16 before recovering and rising back up to the underside of the trendline at the current day’s highs of 0.9117.
It is possible this recovery represents what is known as a “throwback” in technical terms. If so, price will probably go lower after “air-kissing goodbye” the underside of the trendline – though this time with more vigor.
In such a scenario, a break below the 0.8988 lows would confirm a reversal of the short-term trend and result in a substantial extension lower, with an initial target most probably located at 0.8878 where the 100 and 200-day Simple Moving Averages (SMA) converge.
Alternatively a break back inside the channel would reassert the dominance of the bullish uptrend and negate the break down out of the channel that happened on May 14.
Such a move would need to break clearly and decisively back inside the channel on a closing basis, probably with a long green candle or three green candles in a row, the definition of “definitive” in technical terms.
If such a recovery evolves it will mean the break below the red trendline was probably a “false break” and the uptrend remains intact. Such a move would be expected to reach close to the 0.9225 highs of the year.


