
- Bitcoin rebounds above $106,000 as dip-buying triggers a recovery in the broader cryptocurrency market.
- Dogwifhat surges 28% following last week’s sell-off with bulls seeking short-term support above $1.00.
- Mog Coin eyes a breakout above a descending channel after reclaiming the 100-period EMA.
- Popcat eyes a $0.50 comeback after a buy signal from the MACD and an uptrending RSI.
The cryptocurrency market has eased into a broader recovery on Tuesday, led by Bitcoin’s (BTC) uptick from last week’s lows of $103,020. Select meme coins such as Dogwifhat (WIF), Mog Coin (MOG) and Popcat (POPCAT) are holding their double-digit gains accrued in the last 24 hours while showing signs sustaining the rally.
Market overview: Bitcoin resumes uptrend above $106,000
The largest cryptocurrency by market capitalization hovers at around $106,376 at the time of writing, up slightly on the day. This uptick comes amid mixed sentiment, especially with spot Exchange–Traded Funds (ETFs) posting three consecutive days of inflows.
At the same time, investors in the global economy remain concerned about the impact of United States (US) President Donald Trump’s tariffs and the uncertainty surrounding their implementation.
A US court halted the implementation of tariffs last week, citing Trump’s disregard for the Constitution. An appeals court injunction, requested by the Justice Department, quickly followed the ruling and allowed the tariffs to remain in place until the court makes a decision on the appeal.
According to a K33 Research market update, May was one of the strongest months for BTC spot ETFs, which saw an average daily inflow of $238 million. However, the last three days have been characterized by a sharp reversal, with outlaws breaking a 10-day inflow trend.
“The recent outflows may be partly driven by monthly portfolio rebalancing, especially as BTC has outperformed the S&P 500 and [NASDAQ] for three straight months, reaching new all-time highs,” K33 Research highlights. “Mandated allocation adjustments, combined with seasonal patterns of weaker summer performance in crypto markets, likely contributed to selling pressure,” the report adds.
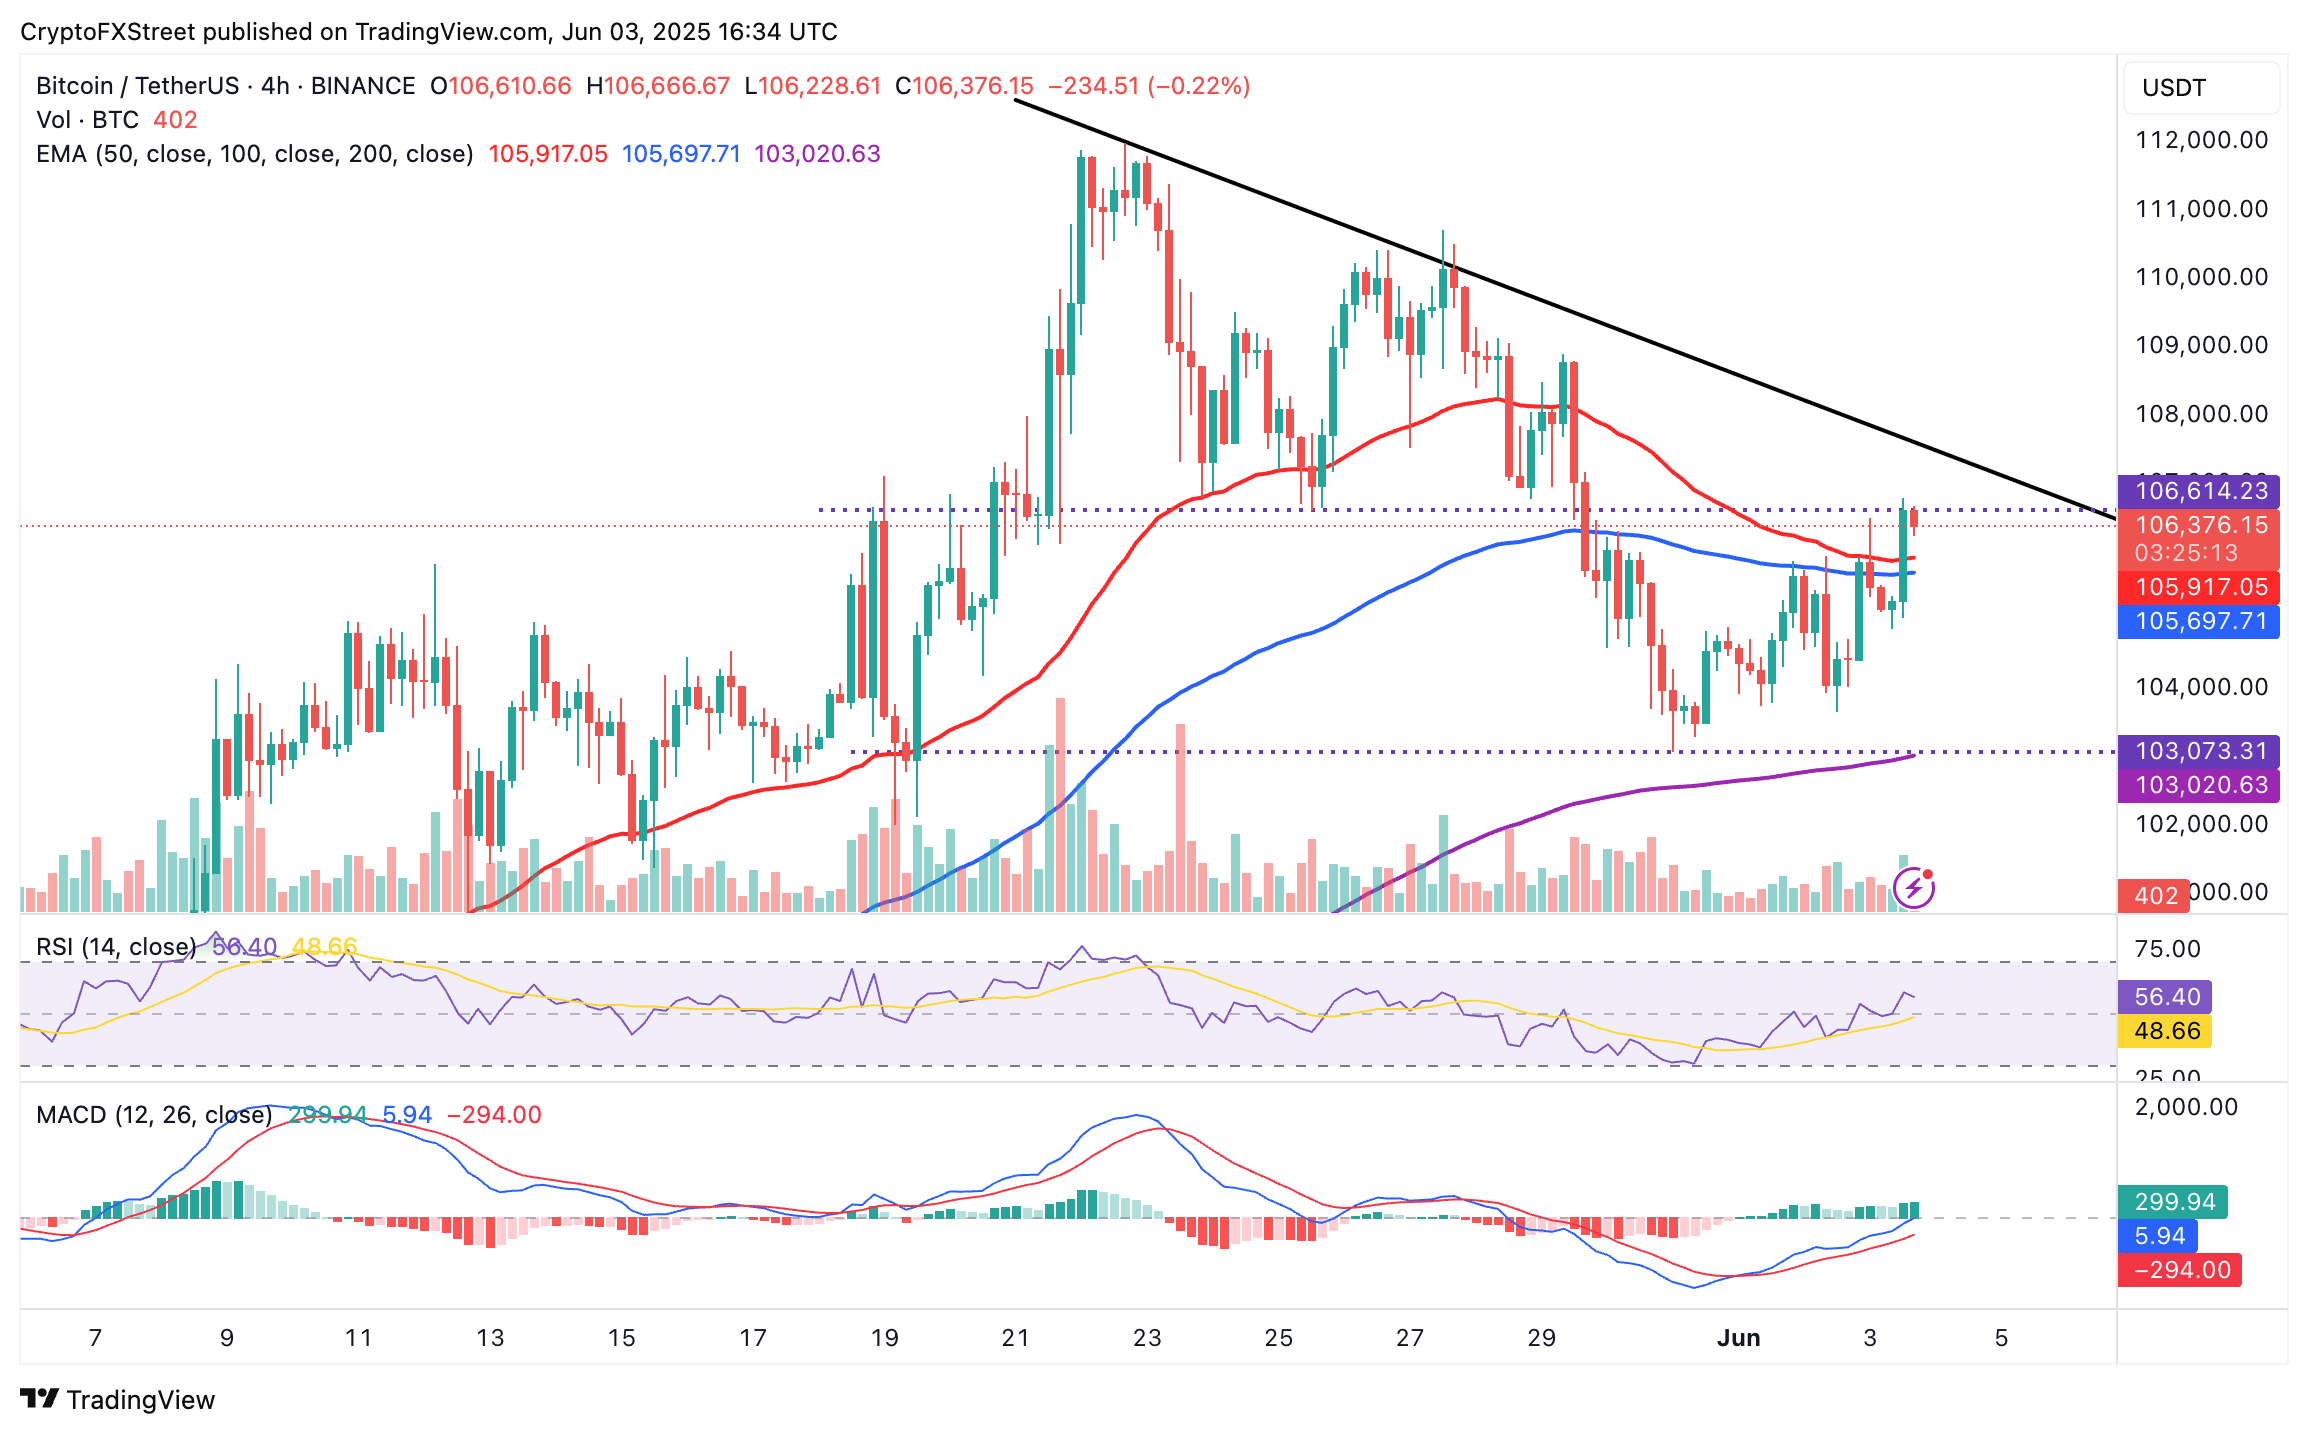
BTC/USDT 4-hour chart
Top meme coins rally amid changing market dynamics
The meme coin sector is experiencing isolated rallies as investors appear to be shifting their focus to highly volatile digital assets. Despite the sector’s market capitalization falling by almost 10% over the last seven days, its value has increased by nearly 3% in the past 24 hours to approximately $67 billion.
Dogwifhat leads the meme coin rally, growing over 8% on the day to slightly above $1.00 at the time of writing. This upswing marks a 28% increase from last week’s crash to $0.84.
WIF currently sits above the 4-hour 100-period Exponential Moving Average (EMA) at $0.98, the 50-period EMA at $0.96 and the 200-period EMA at $0.91. In the event of a reversal, these levels could absorb the sell-side pressure and create a suitable environment for the resumption of the uptrend.
The current path of least resistance is upward, buoyed by a buy signal from the Moving Average Convergence Divergence (MACD) indicator. Such a signal manifests when the blue MACD line crosses above the red signal line. The expanding green histogram bars, alongside an increase in volume, support WIF’s bullish outlook.
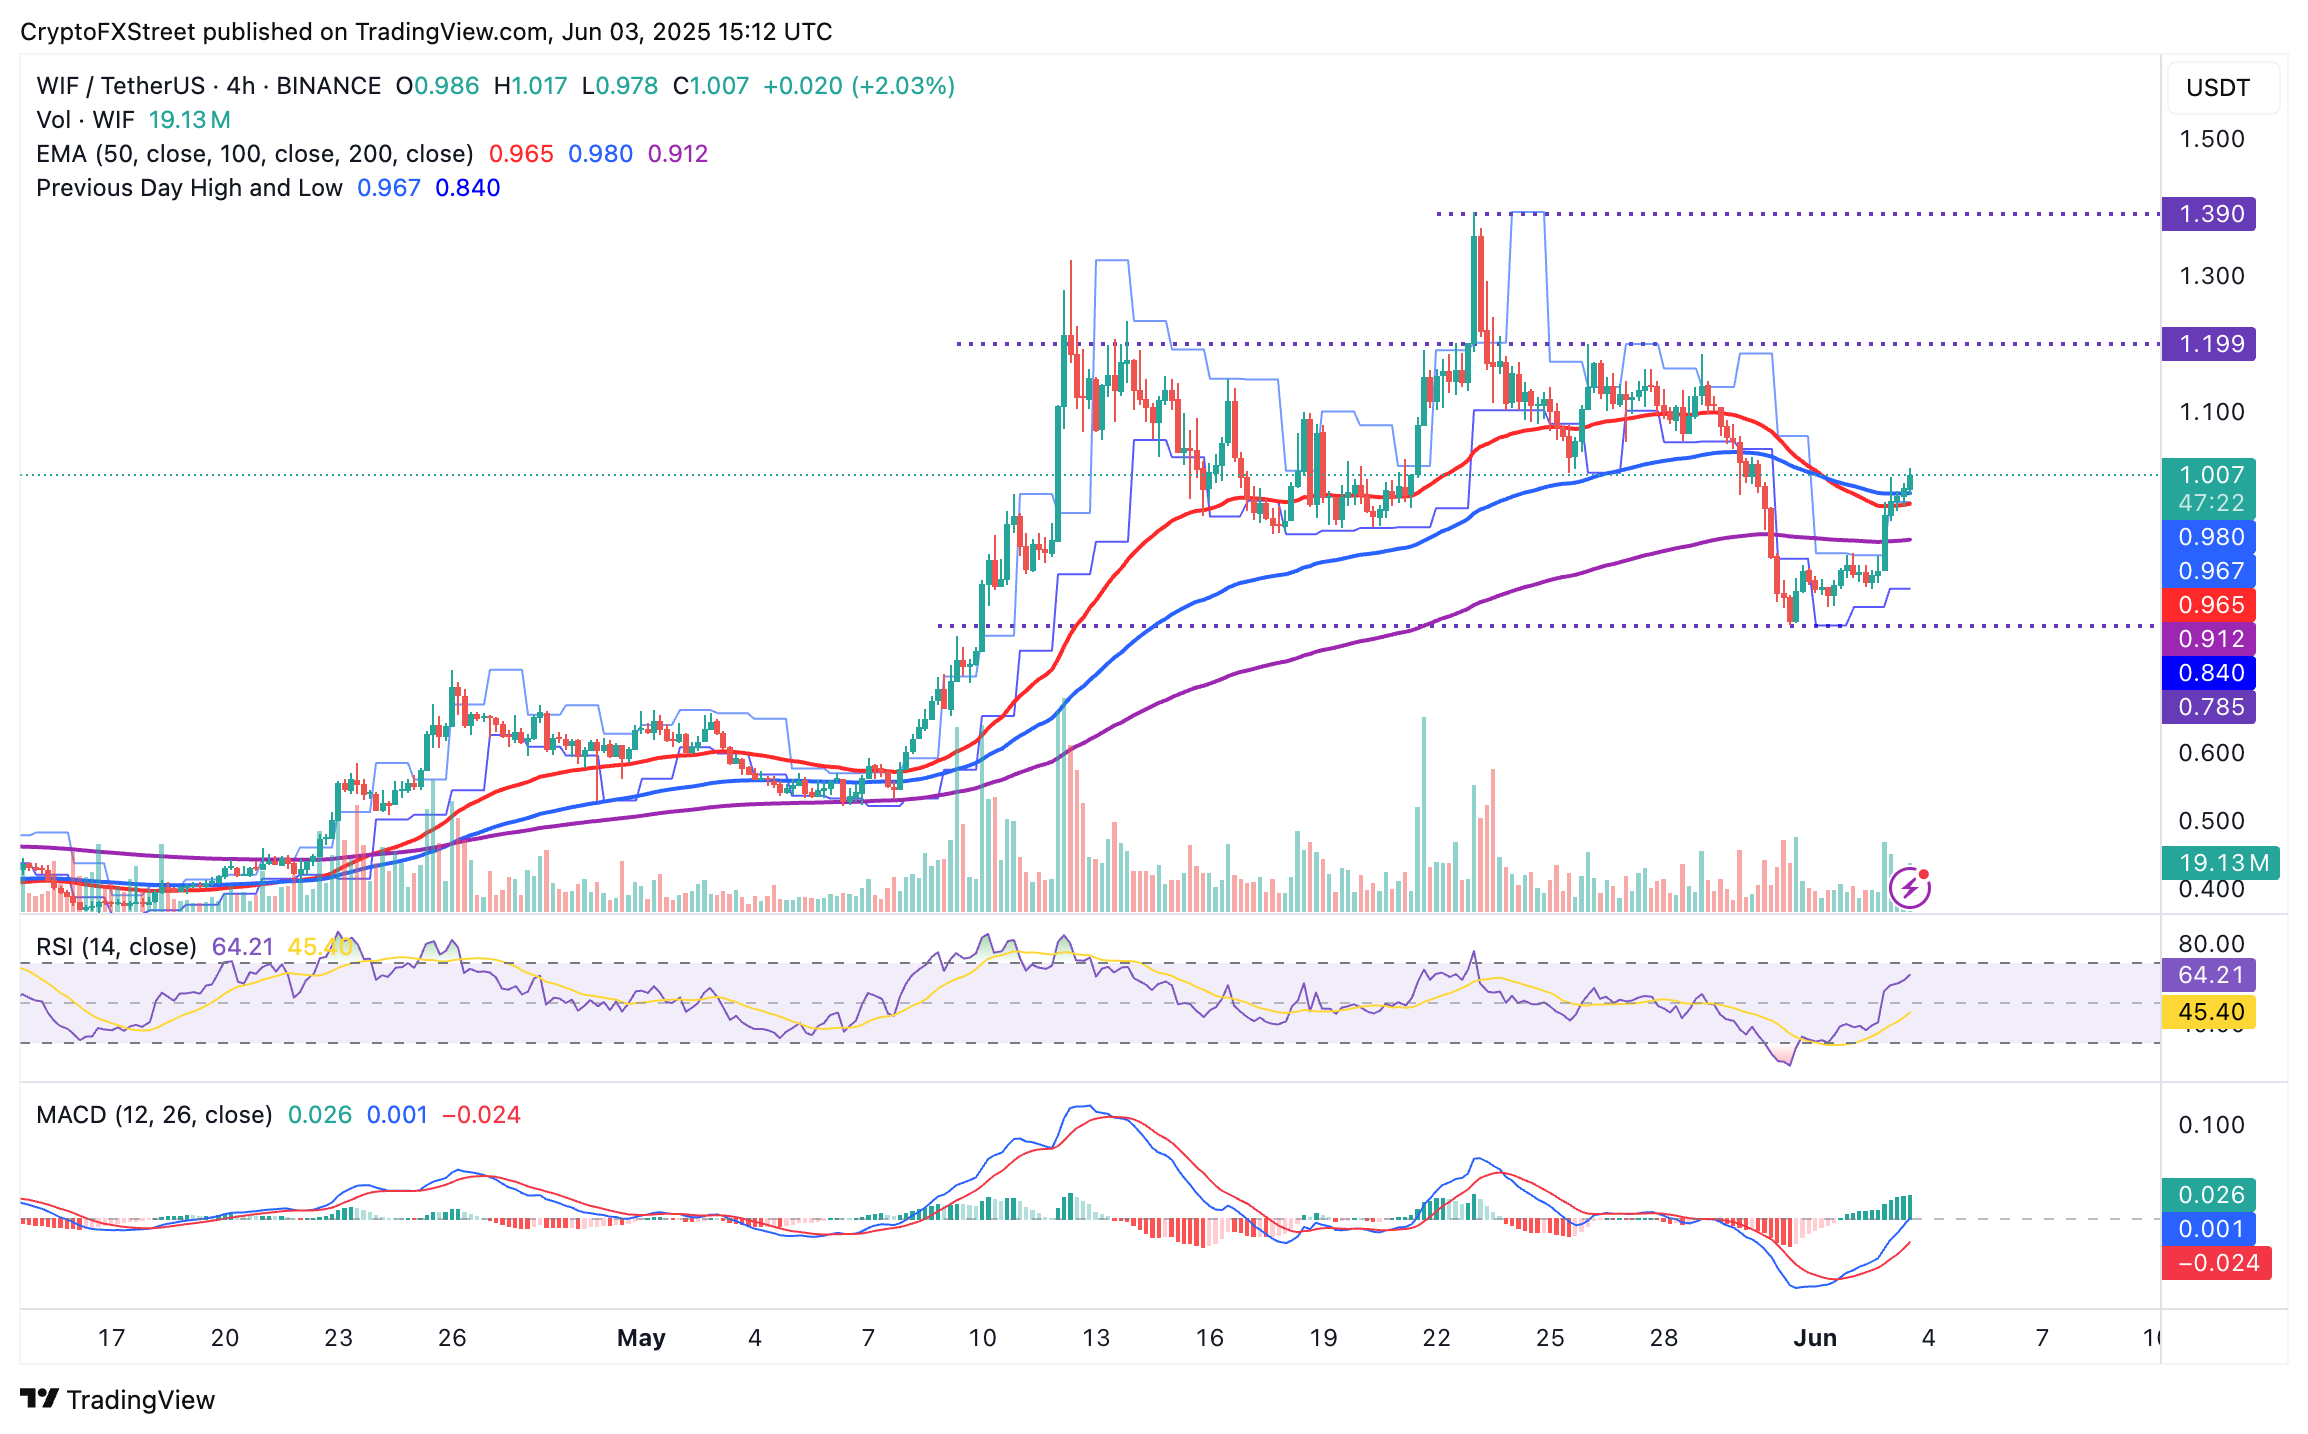
WIF/USD 4-hour chart
On the other hand, Mog Coin is currently trading between two key levels: the 50-period EMA at $0.00000101 and the 100-period EMA resistance at $0.00000104. Meanwhile, the 200-day EMA sits at around $0.000000973.
The MACD indicator supports the bullish outlook by highlighting a buy signal as it approaches and eventually crosses above the center line. Higher support from the 50-period EMA could go a long way in affirming the uptrend. Still, the Relative Strength Index (RSI), which appears to falter at 56, cautions traders to temper their expectations while betting on further price increases.
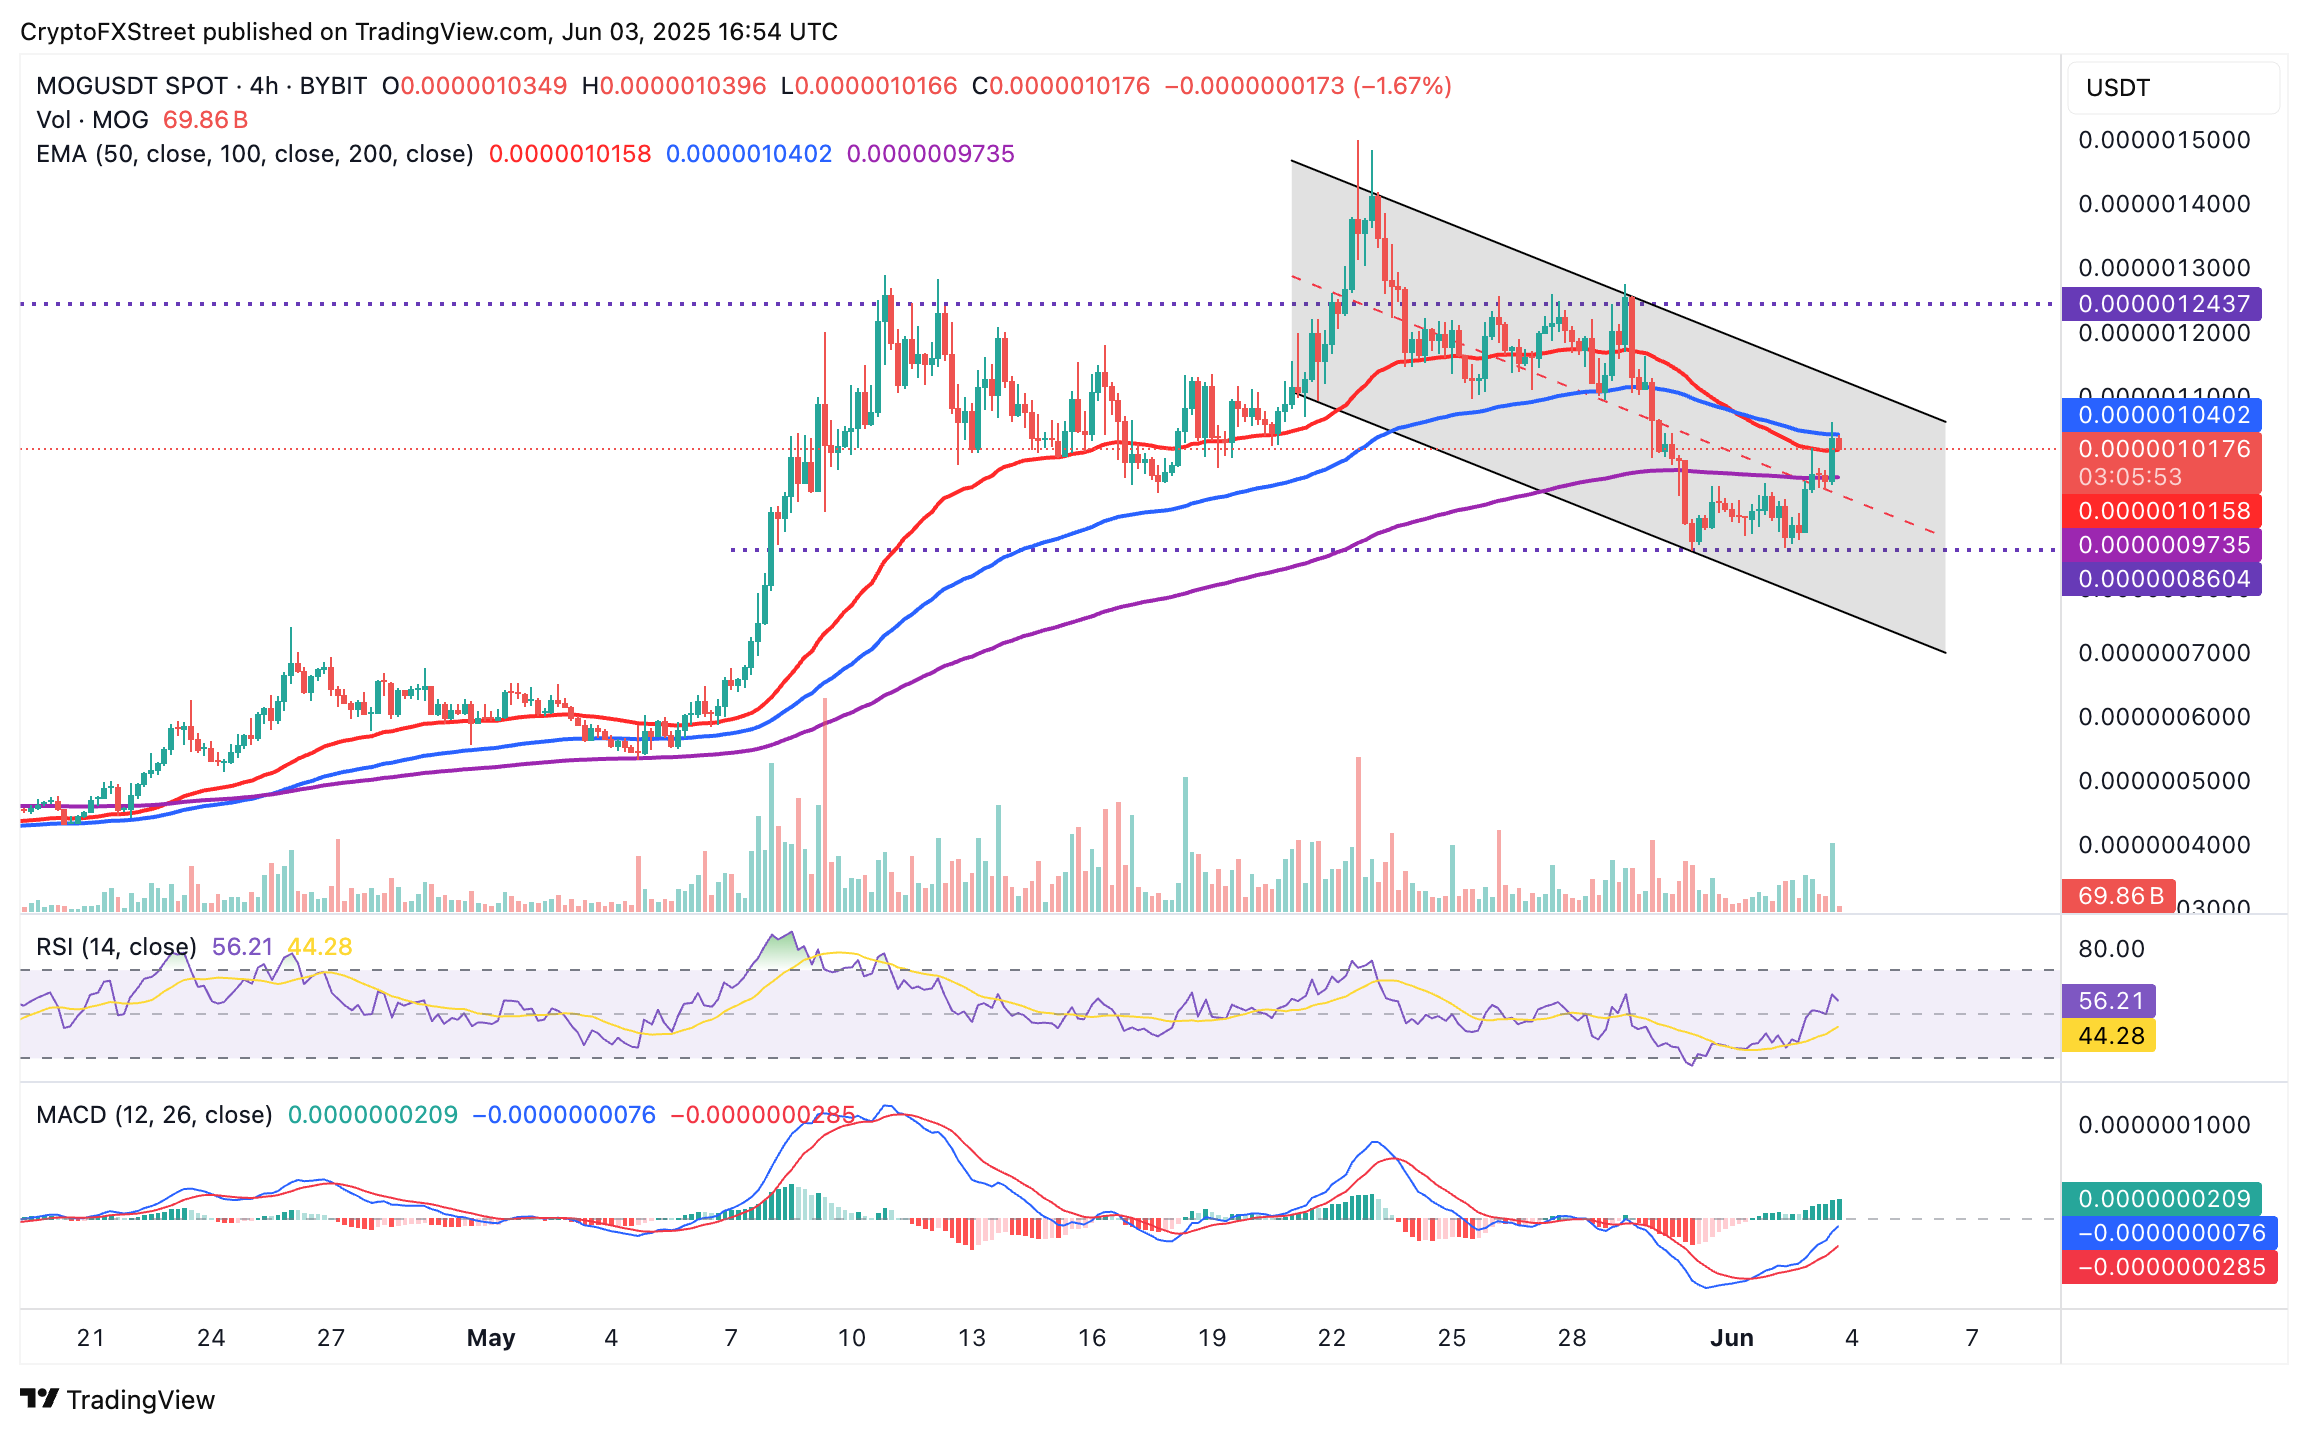
MOG/USDT 4-hour chart
Meanwhile, Popcat hovers at approximately $0.4094, with the 50-period EMA holding firmly as the immediate support at $0.4066. If the MACD holds above the zero line and the RSI remains above the 50 midline, the path of least resistance could remain upward, paving the way for momentum toward $0.50, a key resistance level tested on May 24.
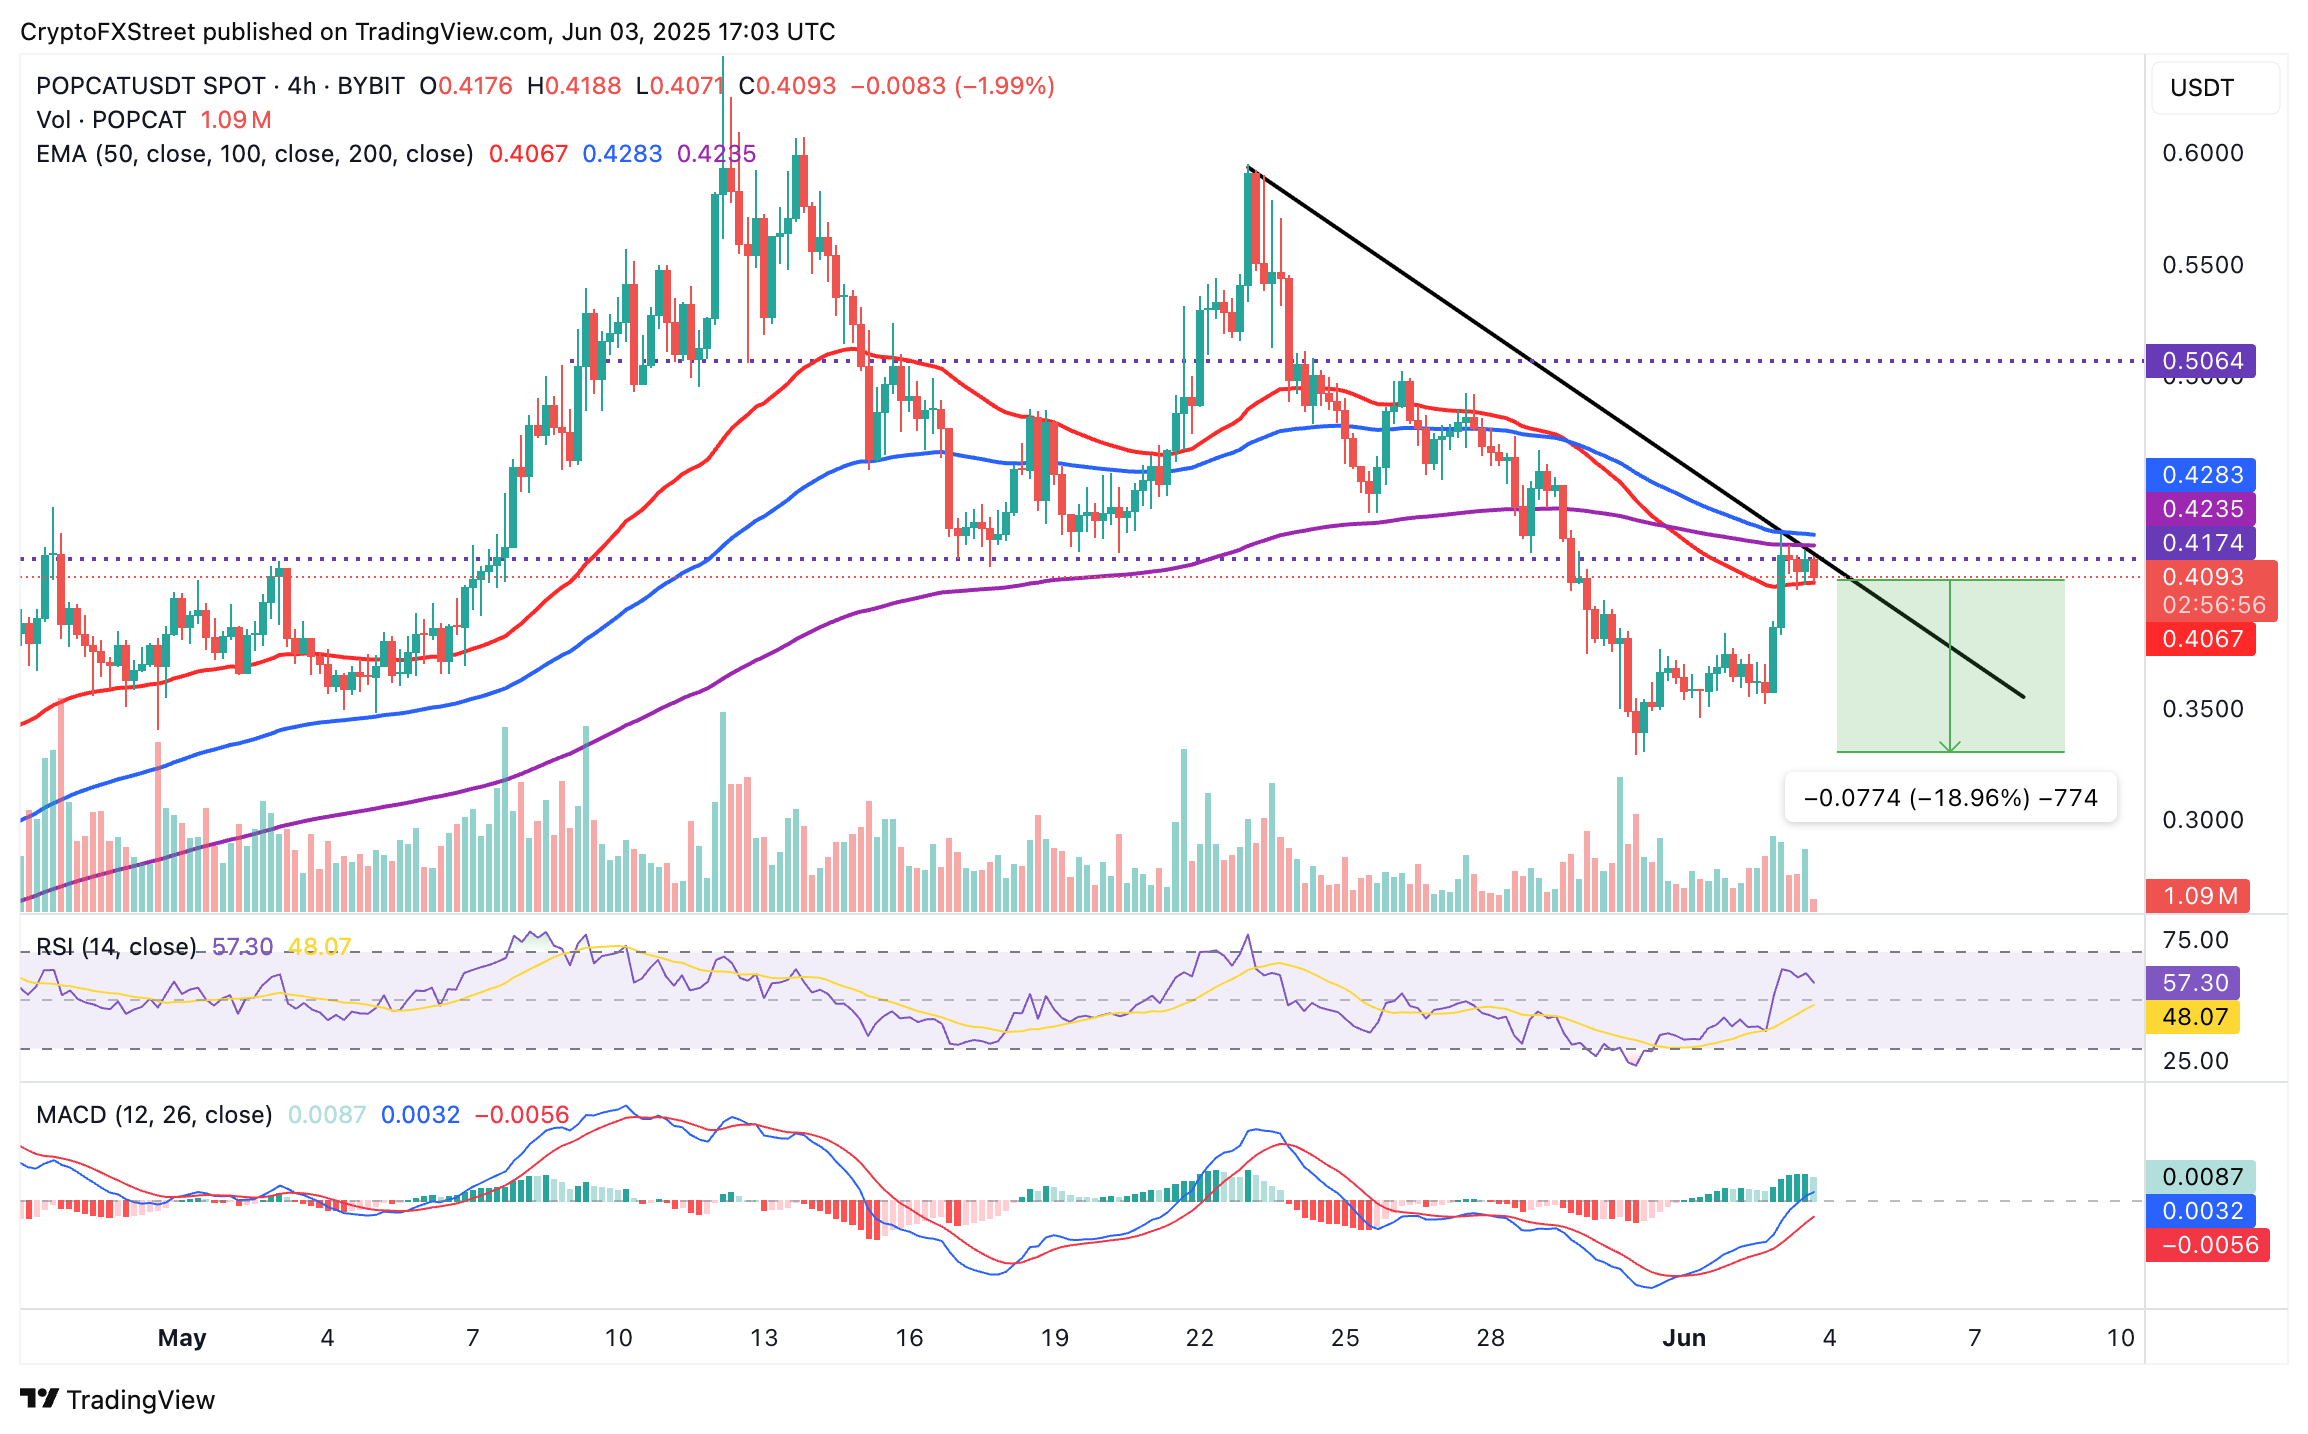
POPCAT/USDT 4-hour chart
Beyond the 50-period EMA, key areas of interest include $0.35, which is 14% below the current market rate, and the demand zone around $0.33, 18% below Popcat’s prevailing price.