


- Dow Jones sheds 0.2% on Monday after NY Fed inflation survey accelerated.
- Markets continue to pin hopes on Fed rate cuts in 2024.
- US PPI, CPI inflation figures loom in the week ahead.
The Dow Jones Industrial Average (DJIA) kicked off the new trading week softly higher before getting knocked back after the Federal Reserve (Fed) Bank of New York revealed that consumer inflation expectations for the coming year accelerated to 3.3%. NY Fed consumer one-year inflation expectations from the previous 3.0% as price growth continues to eat away at consumer purchasing power.
US Producer Price Index (PPI) inflation data is slated for Tuesday. Markets expect Core PPI Inflation for the year ended April to hold steady at 2.4%. On Wednesday, US Consumer Price Index (CPI) inflation data will be updated, with April’s MoM headline CPI inflation expected to hold flat at 0.4%.
Despite rising consumer inflation expectations, market participants continue to lean into Fed rate cut hopes. According to the CME’s FedWatch Tool, rate markets are pricing in 65% odds of a September rate trim, with 90% odds priced in of at least one rate cut in before the end of the year. Market bets on rate cuts have begun to come unchained from overall expectations, with a Reuters poll of economists revealing nearly two-thirds of respondents expecting a September cut. At the same time, polled economists also do not see inflation hitting the Fed’s 2% target until 2026, complicating the outlook for Fed rate cuts.
Dow Jones news
The Dow Jones is down around a fifth of a percent on Monday, with half of the index’s component equities in the red for the day’s market session. Home Depot Inc. (HD) is leading the index lower, tumbling -1.4% and losing around 5 points to trade at $351.52 per share. On the high side, Intel Corp. (INTC) rose around 2.7%, climbing to $30.64 per share.
Dow Jones technical outlook
The Dow Jones Industrial Average rose to 39,640.00 early Monday before an intraday slide, bouncing off of the 39,400.00 level as the major equity index churns within technical levels established late last week.
Daily candlesticks show the Dow Jones index is due for a pullback with the index still trading on the high end of a seven-day winning streak, having risen around 5% from the last swing low into 37,600.00. The Dow Jones’ recent bull run brought the equity index within reach of all-time highs set just below the 40,000.00 price level, and bulls remain firmly in control with price action firmly norther of the 200-day Exponential Moving Average (EMA) at 36,938.27.
Dow Jones five minute chart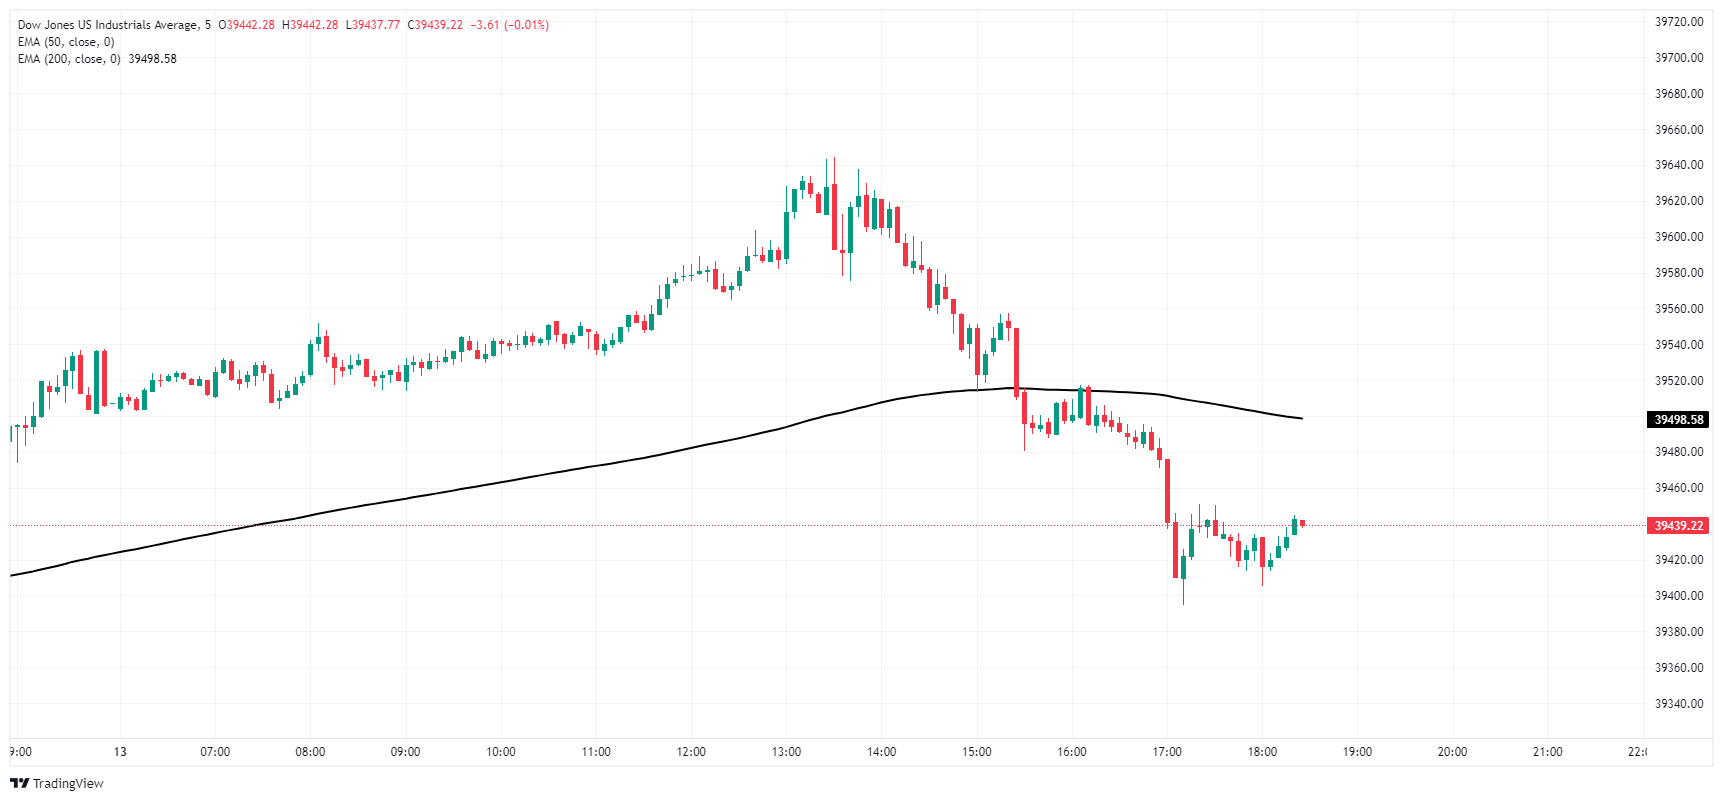
Dow Jones daily chart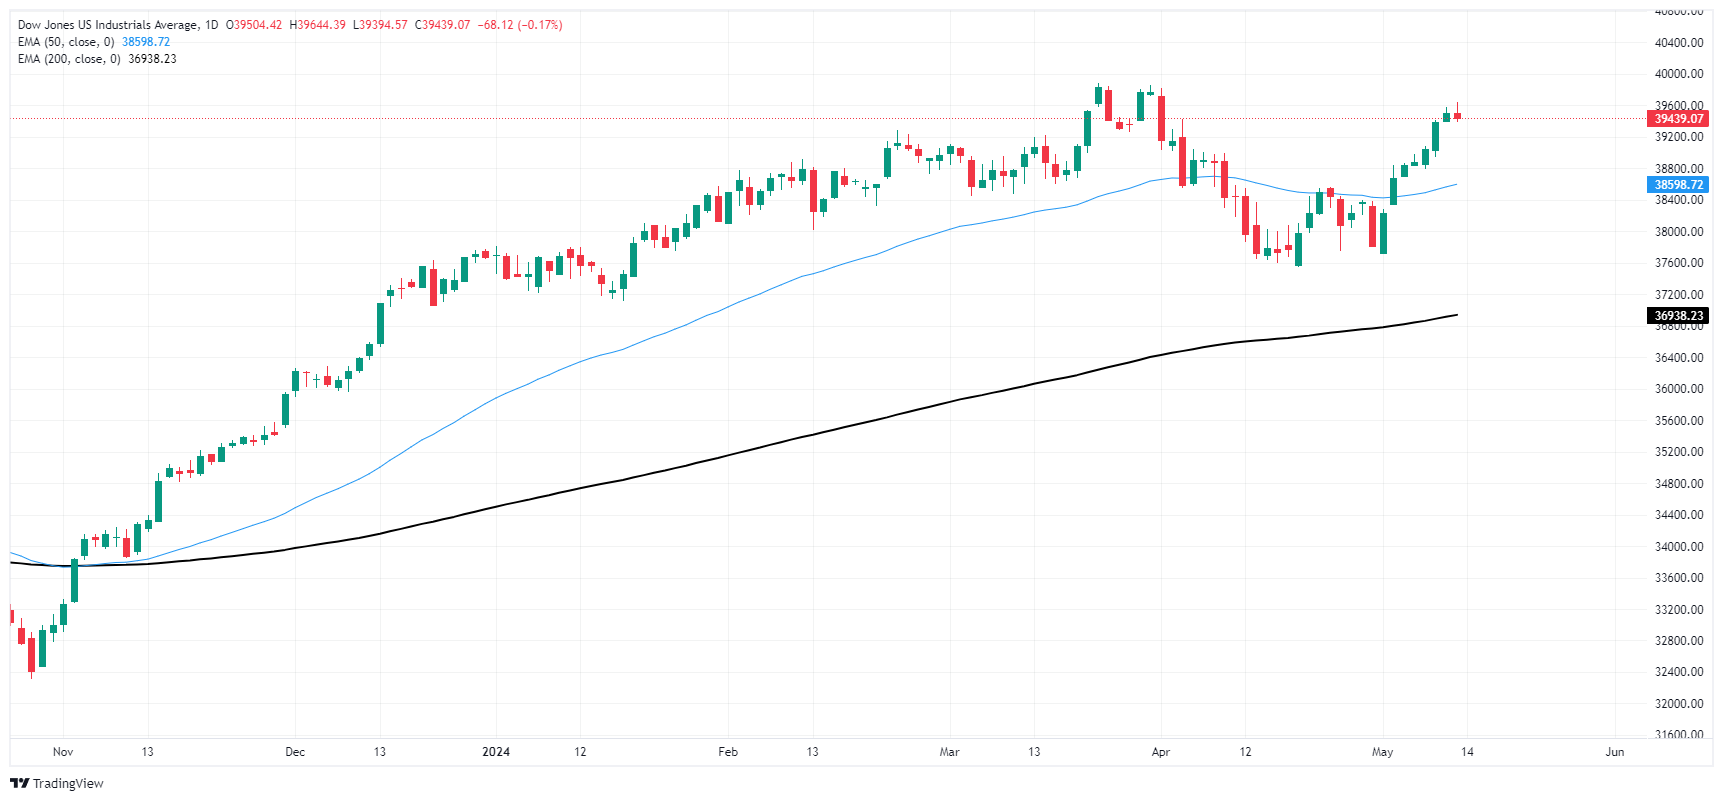
Dow Jones FAQs
The Dow Jones Industrial Average, one of the oldest stock market indices in the world, is compiled of the 30 most traded stocks in the US. The index is price-weighted rather than weighted by capitalization. It is calculated by summing the prices of the constituent stocks and dividing them by a factor, currently 0.152. The index was founded by Charles Dow, who also founded the Wall Street Journal. In later years it has been criticized for not being broadly representative enough because it only tracks 30 conglomerates, unlike broader indices such as the S&P 500.
Many different factors drive the Dow Jones Industrial Average (DJIA). The aggregate performance of the component companies revealed in quarterly company earnings reports is the main one. US and global macroeconomic data also contributes as it impacts on investor sentiment. The level of interest rates, set by the Federal Reserve (Fed), also influences the DJIA as it affects the cost of credit, on which many corporations are heavily reliant. Therefore, inflation can be a major driver as well as other metrics which impact the Fed decisions.
Dow Theory is a method for identifying the primary trend of the stock market developed by Charles Dow. A key step is to compare the direction of the Dow Jones Industrial Average (DJIA) and the Dow Jones Transportation Average (DJTA) and only follow trends where both are moving in the same direction. Volume is a confirmatory criteria. The theory uses elements of peak and trough analysis. Dow’s theory posits three trend phases: accumulation, when smart money starts buying or selling; public participation, when the wider public joins in; and distribution, when the smart money exits.
There are a number of ways to trade the DJIA. One is to use ETFs which allow investors to trade the DJIA as a single security, rather than having to buy shares in all 30 constituent companies. A leading example is the SPDR Dow Jones Industrial Average ETF (DIA). DJIA futures contracts enable traders to speculate on the future value of the index and Options provide the right, but not the obligation, to buy or sell the index at a predetermined price in the future. Mutual funds enable investors to buy a share of a diversified portfolio of DJIA stocks thus providing exposure to the overall index.