


- Global Ethereum ETFs posted net outflows of $19 million.
- Ethereum Foundation sells 100 ETH for $226,868 worth of DAI following price decline.
- Ethereum Layer 2 network activity hits record highs.
- ETH could decline toward symmetry triangle support after seeing rejection around a key descending trendline.
Ethereum (ETH) is down 4% on Monday following another round of sales by the ETH Foundation, totaling 100 ETH. Meanwhile, Layer 2 networks are experiencing record highs in network activity despite the price decline.
Daily digest market movers: Ethereum ETFs outflows, ETH Foundation sells again
Spot Ethereum exchange-traded funds (ETF) globally continued their weekly outflow streak, posting $19 million in negative flows last week, per CoinShares report. US spot ETH ETFs, outweighed by Grayscale’s ETHE outflow pressure, were responsible for over 67% of the flows.
Following CoinShares’ report, the Ethereum Foundation sold 100 ETH for $226,868 DAI a few hours ago, per Spot On Chain. The move has taken the Foundation’s total sales in the past few weeks to 650 ETH despite criticism from a few crypto community members.
Notably, ETH’s price during most of the Foundation’s sales have turned out to be weekly price tops. While most of its ETH sales are too small to cause a market decline, investors may be using the ETH Foundation activity as a proxy to time price tops, leading to a self-fulfilling prophecy.
Despite the Foundation’s sales, crypto analyst HedgeX posted a chart on X showing that Ethereum validators reached an all-time high on Monday. Increasing validators implies growing decentralization, which is one of the key ethos of Web3.
Meanwhile, Ethereum Layer 2s hit a record high of over $10 billion in total value locked (TVL), over 2x of Solana’s TVL, per Leon Waidmann, Head of Research at Onchain Insights. Apart from TVL, the Layer 2 user base also grew more than 35x weekly to reach a high of over 10 million active addresses, per data from growthepie.
ETH Layer 2 Weekly Active Addresses
ETH technical analysis: Ethereum sees rejection around key trendline
Ethereum is trading around $2,280 on Monday, down 4% on the day. In the past 24 hours, ETH has seen nearly $61 million in liquidations, with long and short liquidations accounting for $54.76 million and $6.06 million, respectively, per Coinglass data.
Ethereum is trading within a symmetry triangle that dates back to November 2021. After seeing a rejection on Friday around a descending trendline extending from May 27, ETH is fast declining following the resumption of traditional markets on Monday.
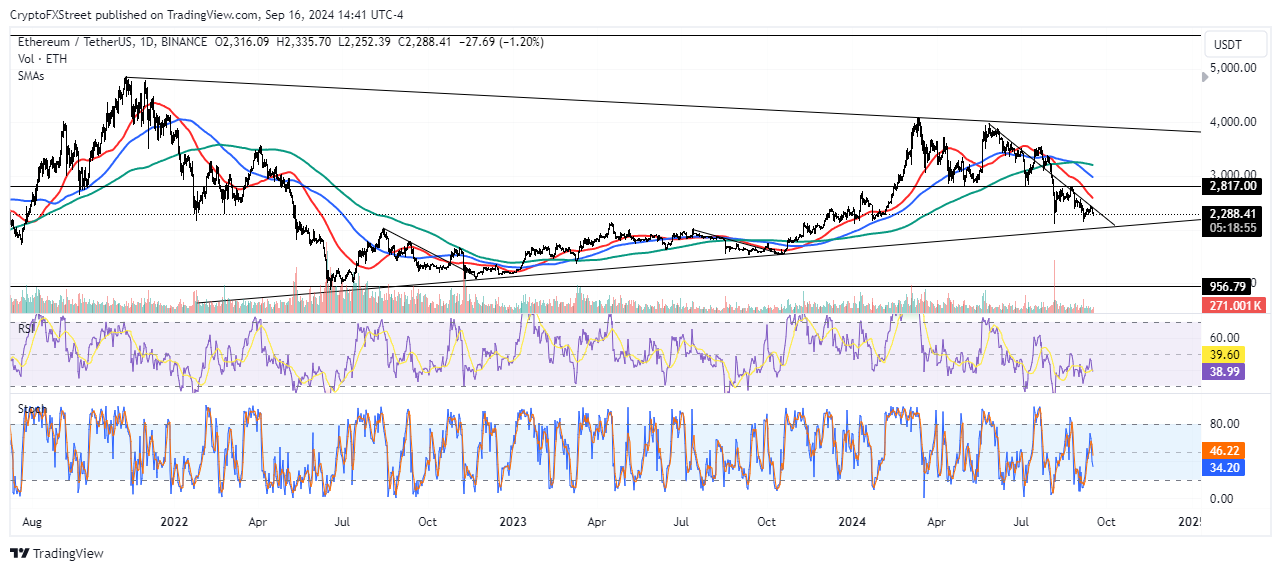
ETH/USDT Daily chart
The trendline within the symmetry triangle suggests ETH could decline toward the $2,100 to $2,200 range in the coming days. ETH posted similar declines from August to November 2022 and July to October 2023 before eventually staging a rally. ETH could see an extended rally around October or November if history repeats.
On the way up, ETH faces resistance around the 2,817 price level. A sustained move above this level could fuel bullish momentum for ETH, considering it was a critical support level for over four months before flipping into a resistance following the market crash on August 5. The 50-day, 100-day and 200-day Simple Moving Averages (SMA) also stand as potential resistance.
The Relative Strength Index (RSI) and Stochastic Oscillator (Stoch) momentum indicators are below their neutral levels, indicating prevailing bearish pressure.
A sustained move below the symmetry triangle will invalidate the thesis.
In the short term, ETH could decline to $2,261 to liquidate positions worth $24.73 million.
Cryptocurrency metrics FAQs
The developer or creator of each cryptocurrency decides on the total number of tokens that can be minted or issued. Only a certain number of these assets can be minted by mining, staking or other mechanisms. This is defined by the algorithm of the underlying blockchain technology. Since its inception, a total of 19,445,656 BTCs have been mined, which is the circulating supply of Bitcoin. On the other hand, circulating supply can also be decreased via actions such as burning tokens, or mistakenly sending assets to addresses of other incompatible blockchains.
Market capitalization is the result of multiplying the circulating supply of a certain asset by the asset’s current market value. For Bitcoin, the market capitalization at the beginning of August 2023 is above $570 billion, which is the result of the more than 19 million BTC in circulation multiplied by the Bitcoin price around $29,600.
Trading volume refers to the total number of tokens for a specific asset that has been transacted or exchanged between buyers and sellers within set trading hours, for example, 24 hours. It is used to gauge market sentiment, this metric combines all volumes on centralized exchanges and decentralized exchanges. Increasing trading volume often denotes the demand for a certain asset as more people are buying and selling the cryptocurrency.
Funding rates are a concept designed to encourage traders to take positions and ensure perpetual contract prices match spot markets. It defines a mechanism by exchanges to ensure that future prices and index prices periodic payments regularly converge. When the funding rate is positive, the price of the perpetual contract is higher than the mark price. This means traders who are bullish and have opened long positions pay traders who are in short positions. On the other hand, a negative funding rate means perpetual prices are below the mark price, and hence traders with short positions pay traders who have opened long positions.