- USD/JPY maintains uptrend, trading at 155.66 after hitting a daily low of 155.25.
- Technical outlook suggests further gains with resistance at 156.05, 157.00, and YTD high at 160.32.
- Key support levels include 155.18, 155.00, and May 16 low at 153.60 if price drops below 155.69.
The USD/JPY extended its gains late on Friday’s North American session, though it’s set to finish the week unchanged. The major trades at 155.66, up 0.18% after hitting a daily low of 155.25.
USD/JPY Price Analysis: Technical outlook
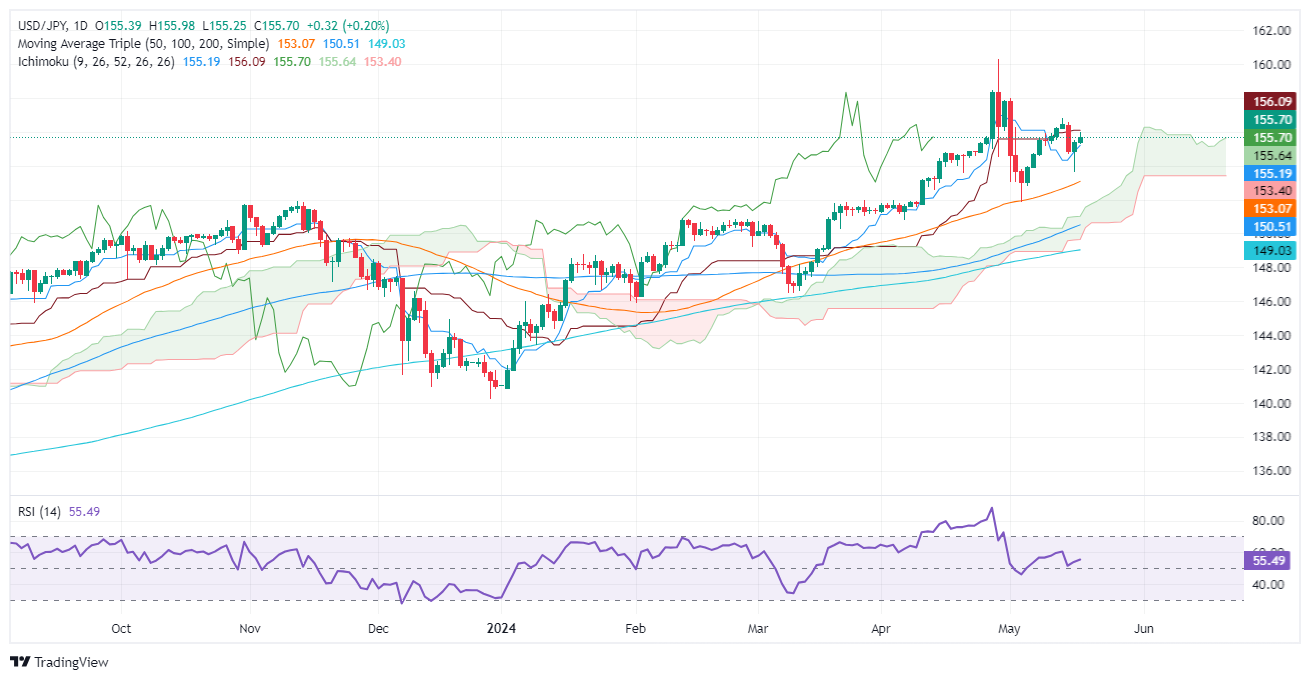
Despite the conditions to extend their gains, traders should be aware of the Japanese authority’s intervention threats. That said, the USD/JPY uptrend remains intact as long as price action achieves two goals: persisting above the Ichimoku Cloud (Kumo) and staying above the uptrend trendline drawn from the January 2024 lows.
The Relative Strength Index (RSI) favors buyers, standing above the 50-midline with enough room to spare before reaching overbought territory.
Therefore, the path of least resistance is upwards. The first resistance would be the Kijun-Sen at 156.05. Once cleared, the next stop would be 157.00, followed by the April 26 high of 158.44, ahead of challenging the year-to-date (YTD) high at 160.32.
On the flip side, if USD/JPY drops below the Senkou Span A of 155.69, the pair could be headed towards retesting lower support levels. Bulls’ first line of defense would be the Tenkan-Sen at 155.18, followed by 155.00. Once hurdled, the next stop would be the May 16 low of 153.60, followed by the Sekou Span B at 153.06.
USD/JPY Price Action – Daily Chart
Japanese Yen PRICE Today
The table below shows the percentage change of Japanese Yen (JPY) against listed major currencies today. Japanese Yen was the strongest against the Swiss Franc.
| USD | EUR | GBP | JPY | CAD | AUD | NZD | CHF | |
|---|---|---|---|---|---|---|---|---|
| USD | -0.02% | -0.25% | 0.19% | -0.04% | -0.24% | -0.23% | 0.30% | |
| EUR | 0.02% | -0.24% | 0.22% | -0.01% | -0.20% | -0.19% | 0.30% | |
| GBP | 0.25% | 0.24% | 0.44% | 0.22% | 0.04% | 0.03% | 0.53% | |
| JPY | -0.19% | -0.22% | -0.44% | -0.26% | -0.43% | -0.45% | 0.09% | |
| CAD | 0.04% | 0.01% | -0.22% | 0.26% | -0.19% | -0.18% | 0.33% | |
| AUD | 0.24% | 0.20% | -0.04% | 0.43% | 0.19% | 0.00% | 0.51% | |
| NZD | 0.23% | 0.19% | -0.03% | 0.45% | 0.18% | -0.01% | 0.51% | |
| CHF | -0.30% | -0.30% | -0.53% | -0.09% | -0.33% | -0.51% | -0.51% |
The heat map shows percentage changes of major currencies against each other. The base currency is picked from the left column, while the quote currency is picked from the top row. For example, if you pick the Japanese Yen from the left column and move along the horizontal line to the US Dollar, the percentage change displayed in the box will represent JPY (base)/USD (quote).