


- Fetch.ai price shows signs of exhaustion as it hovers around $2.223.
- A break of the bullish market structure suggests a potential pullback.
- On-chain metrics investors are not interested in FET at the current price levels.
Fetch.ai (FET) price performance in the first quarter was nothing short of magical. The market value of FET rose by 587% between February 5 and March 28, a climb that is now facing exhaustion and could lead to further downside moves.
Fetch.ai price paints bearish outlook
Fetch.ai price set an all-time high (ATH) on March 28 at $3.489. In 16 days after this ATH, FET crashed nearly 55%, setting up a local bottom at $1.570. This sudden crash created a lower high and a lower low, signaling a break in the bullish market structure. Currently, FET hovers below the $2.583 to $2.425 resistance zone, where it has faced two rejections so far. Interestingly, the second retest of the aforementioned hurdle set up a lower low relative to the first one, indicating that the bullish momentum is further waning.
In the past week, Bitcoin saw a small uptick to $64,000, which caused many altcoins to climb higher. For example, Worldcoin – another AI-based token – saw a near 50% uptick. Fetch.ai price, however, failed to match WLD’s pace, further adding credence to the possibility of a breakdown.
A dip into the $1.700 to $1.805 demand zone is a conservative outlook for FET enthusiasts. If such a scenario occurs, it would be a good time to consider buying the AI-based altcoin.
This outlook would suggest that Fetch.ai price could crash 20% in the coming weeks.
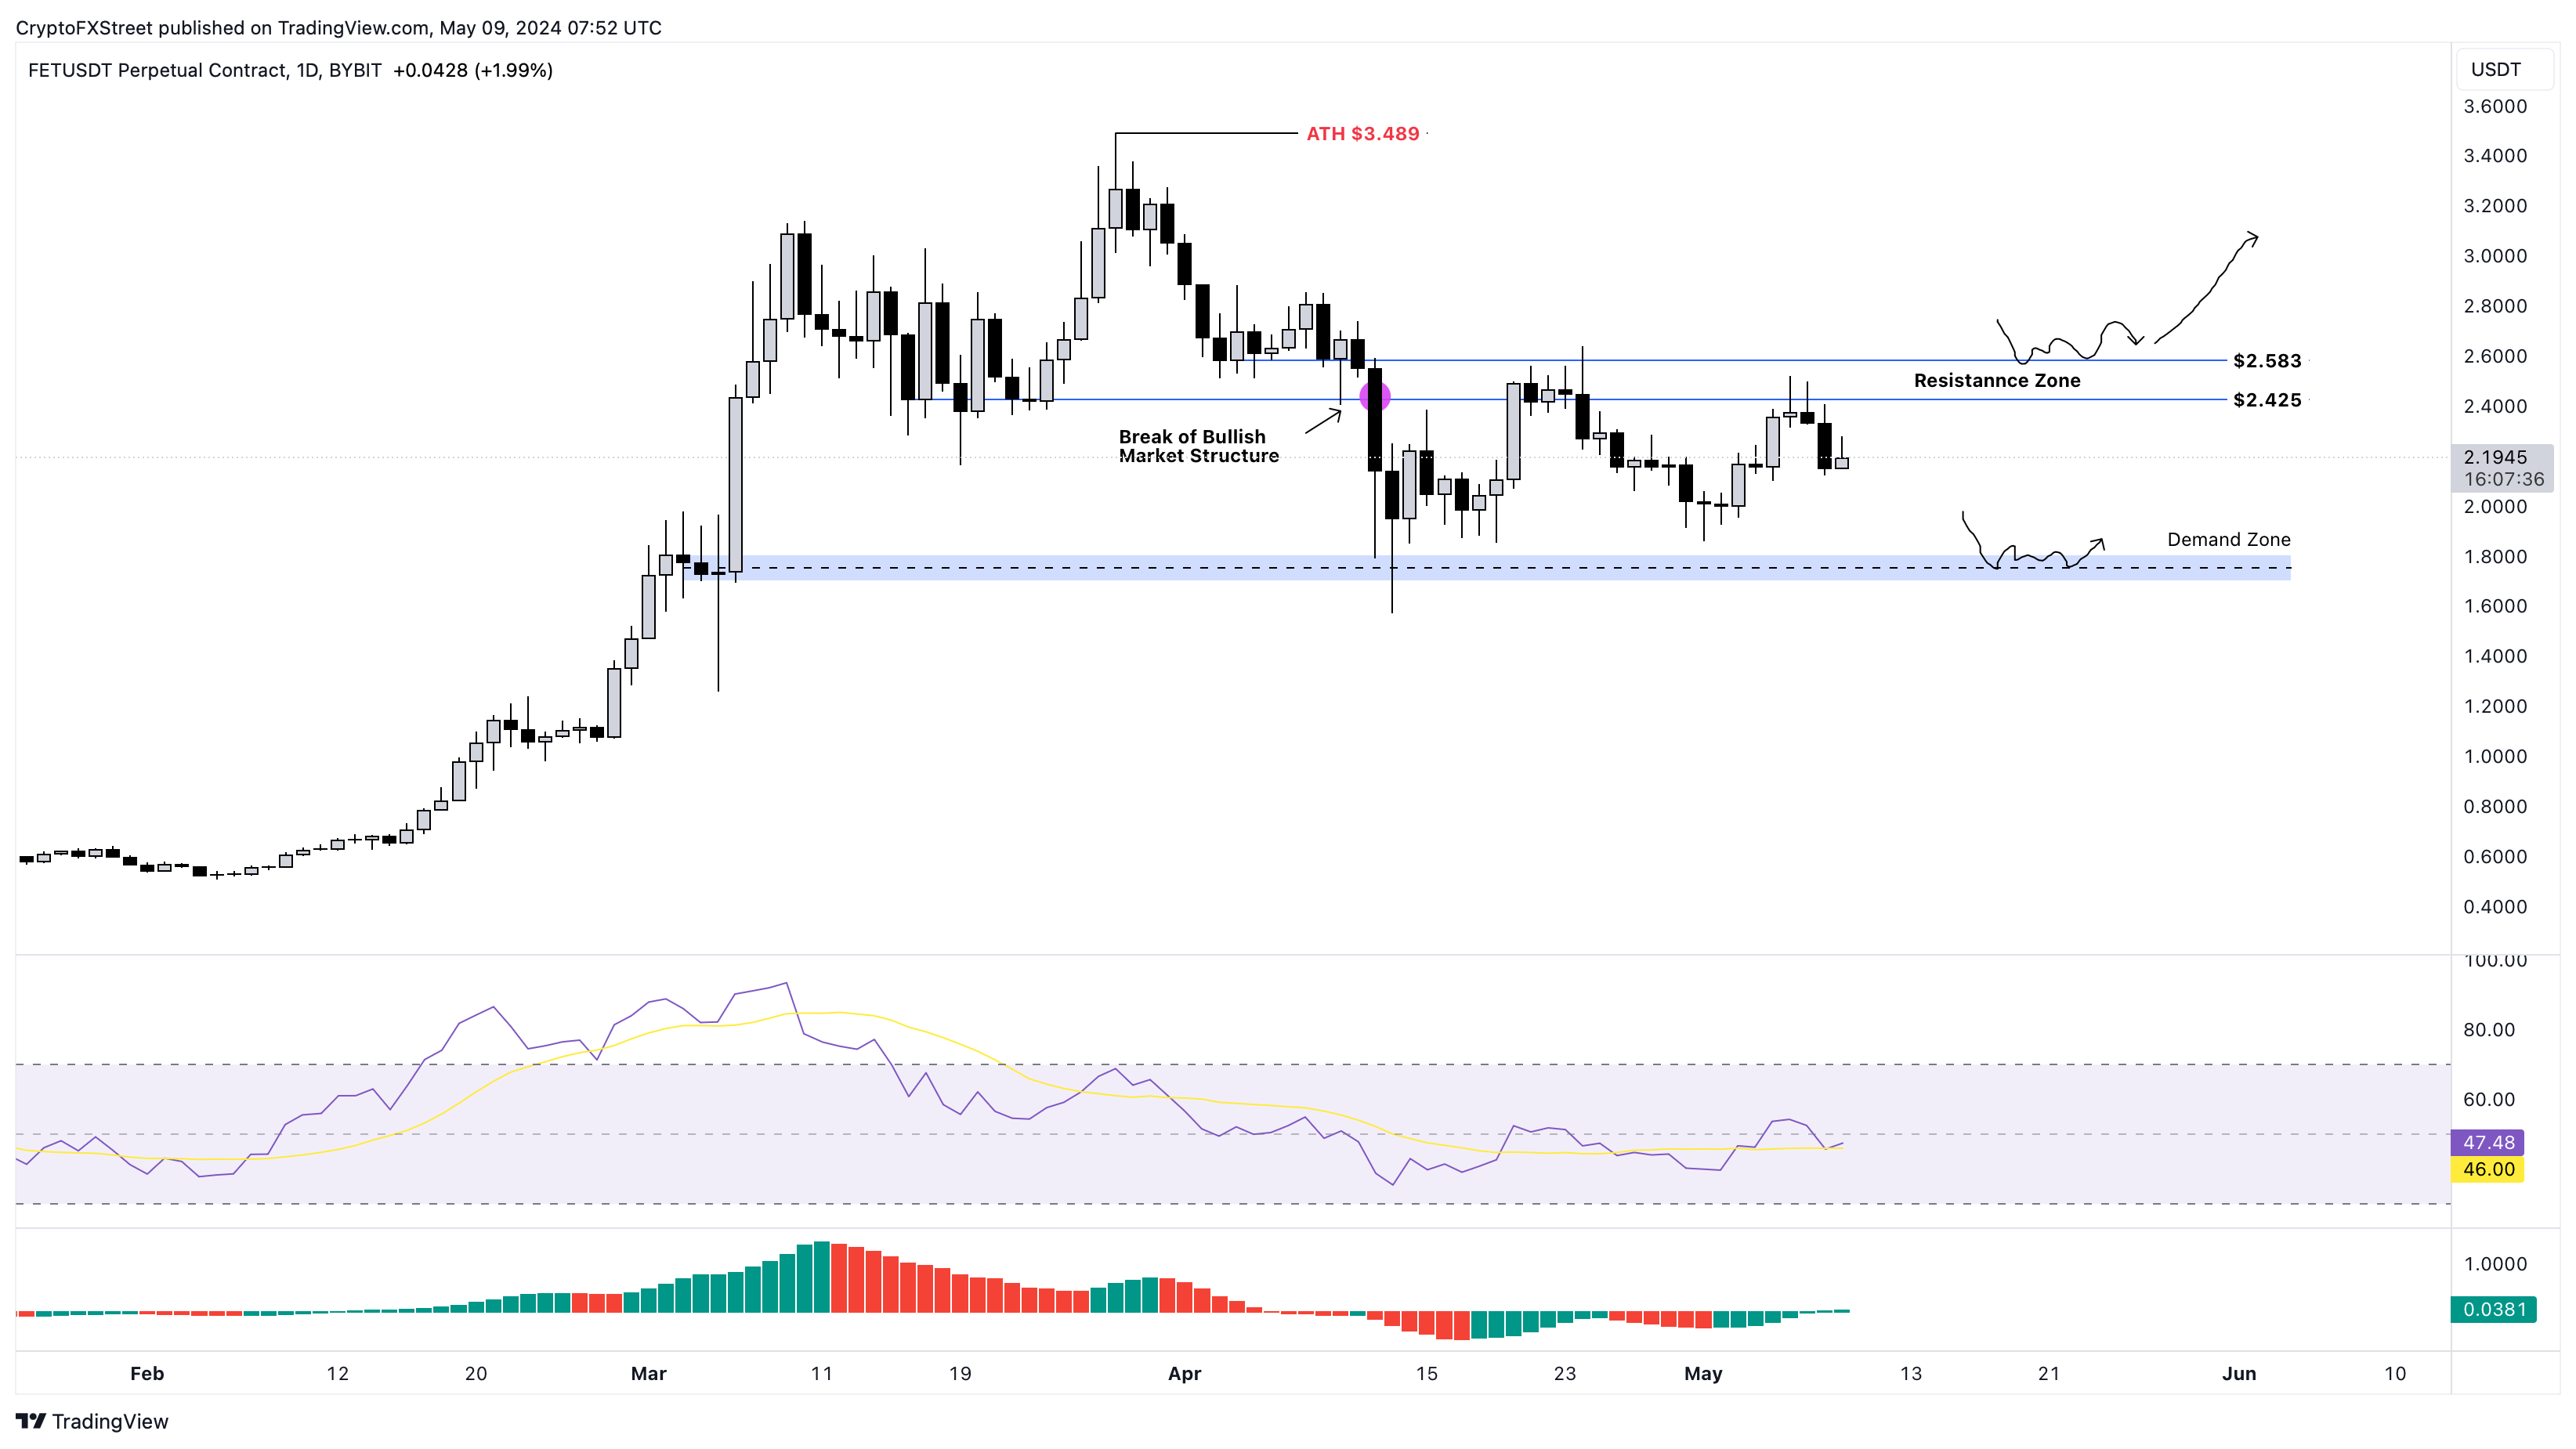
FET/USDT 1-day chart
According to Santiment’s 7-day Market Value to Realized Value (MVRV) ratio for Fetch.ai price has touched the 13% mark and is currently hovering around 10%. This value of 10% is the average profit of investors who bought FET in the past week.
A higher positive value shows larger unrealized gains, which could be seen as a sell signal. The 13% level, as shown by the horizontal line in the 7-day MVRV chart, can be viewed as a sell zone, considering that FET faced a sell-off and local top formations in the recent past.
%20%5B10.57.16,%2009%20May,%202024%5D-638508427507565984.png)
FET 30-day MVRV
Furthermore, Santiment’s Network Growth indicator shows new addresses being created on the Fetch.ai blockchain. If this index sees an uptick, it would denote capital inflows, suggesting that investors are interested in FET at the current price levels.
Considering that the Network Growth indicator has been on the slump in the past few weeks adds more value to the potential correction thesis outlined above.
%20%5B11.00.06,%2009%20May,%202024%5D-638508427701924239.png)
FET Network Growth
All in all, the outlook for FET looks bearish from both technical and on-chain perspective and could trigger a short-term double-digit correction. But for things to improve and Fetch.ai price to climb, it needs to overcome the $2.583 to $2.425 resistance zone and flip it into a support area. If FET manages to sustain above and market conditions turn bullish, FET could climb 35% and contest the ATH of $3.489.
Also read: FET suffers 2% decline as whales deposit Fetch.AI tokens to exchanges