
- Gold price loses traction in Thursday’s Asian session.
- The downtick of the yellow metal is backed by the stronger USD and higher US yields.
- Gold traders await the US Q1 GDP data for fresh impetus and monitor the Middle East geopolitical risks.
Gold price (XAU/USD) trades in negative territory on Thursday, supported by the firmer US Dollar (USD) and higher US yields. The diminishing expectation of the Federal Reserve’s (Fed) rate cut in September exerts some selling pressure on the precious metal as it will increase gold’s opportunity costs.
Investors will monitor the second estimate of the US Gross Domestic Product (GDP) for Q1 2024 on Thursday. In the event that the US economy shows a stronger-than-expected reading, this might further lift the USD and weigh on the USD-denominated gold price. Nonetheless, the ongoing geopolitical tensions in the Middle East might boost traditional safe-haven assets like gold. Also, the rising demand from the central bank might cap the downside for yellow metal in the near term.
Daily Digest Market Movers: Gold price remains vulnerable amid stronger US data
- The Israeli military said on Wednesday that it established “operational control” over the Philadelphi Corridor, a 14-kilometer (8.7 miles) strip of land along the border between Gaza and Egypt, per CNN.
- Global physically-backed gold Exchange-Traded Funds (ETFs) witnessed a net outflow of 11.3 metric tonnes last week, according to the World Gold Council.
- Fed Atlanta President Bostic said on Thursday that the breadth of price gains is still significant, but less inflation breadth would add to confidence for a rate cut.
- Economic activity continued to expand in the US and prices increased modestly from early April to mid-May. Overall outlooks were more pessimistic amid reports of rising uncertainty and greater downside risks, according to the Fed’s Beige Book released Wednesday.
- Markets are pricing in a 50% chance that the Fed will hold interest rates in September, according to the CME FedWatch Tool.
- The US Gross Domestic Product (GDP) number is estimated to expand at a 1.3% annual pace in the first quarter of 2024.
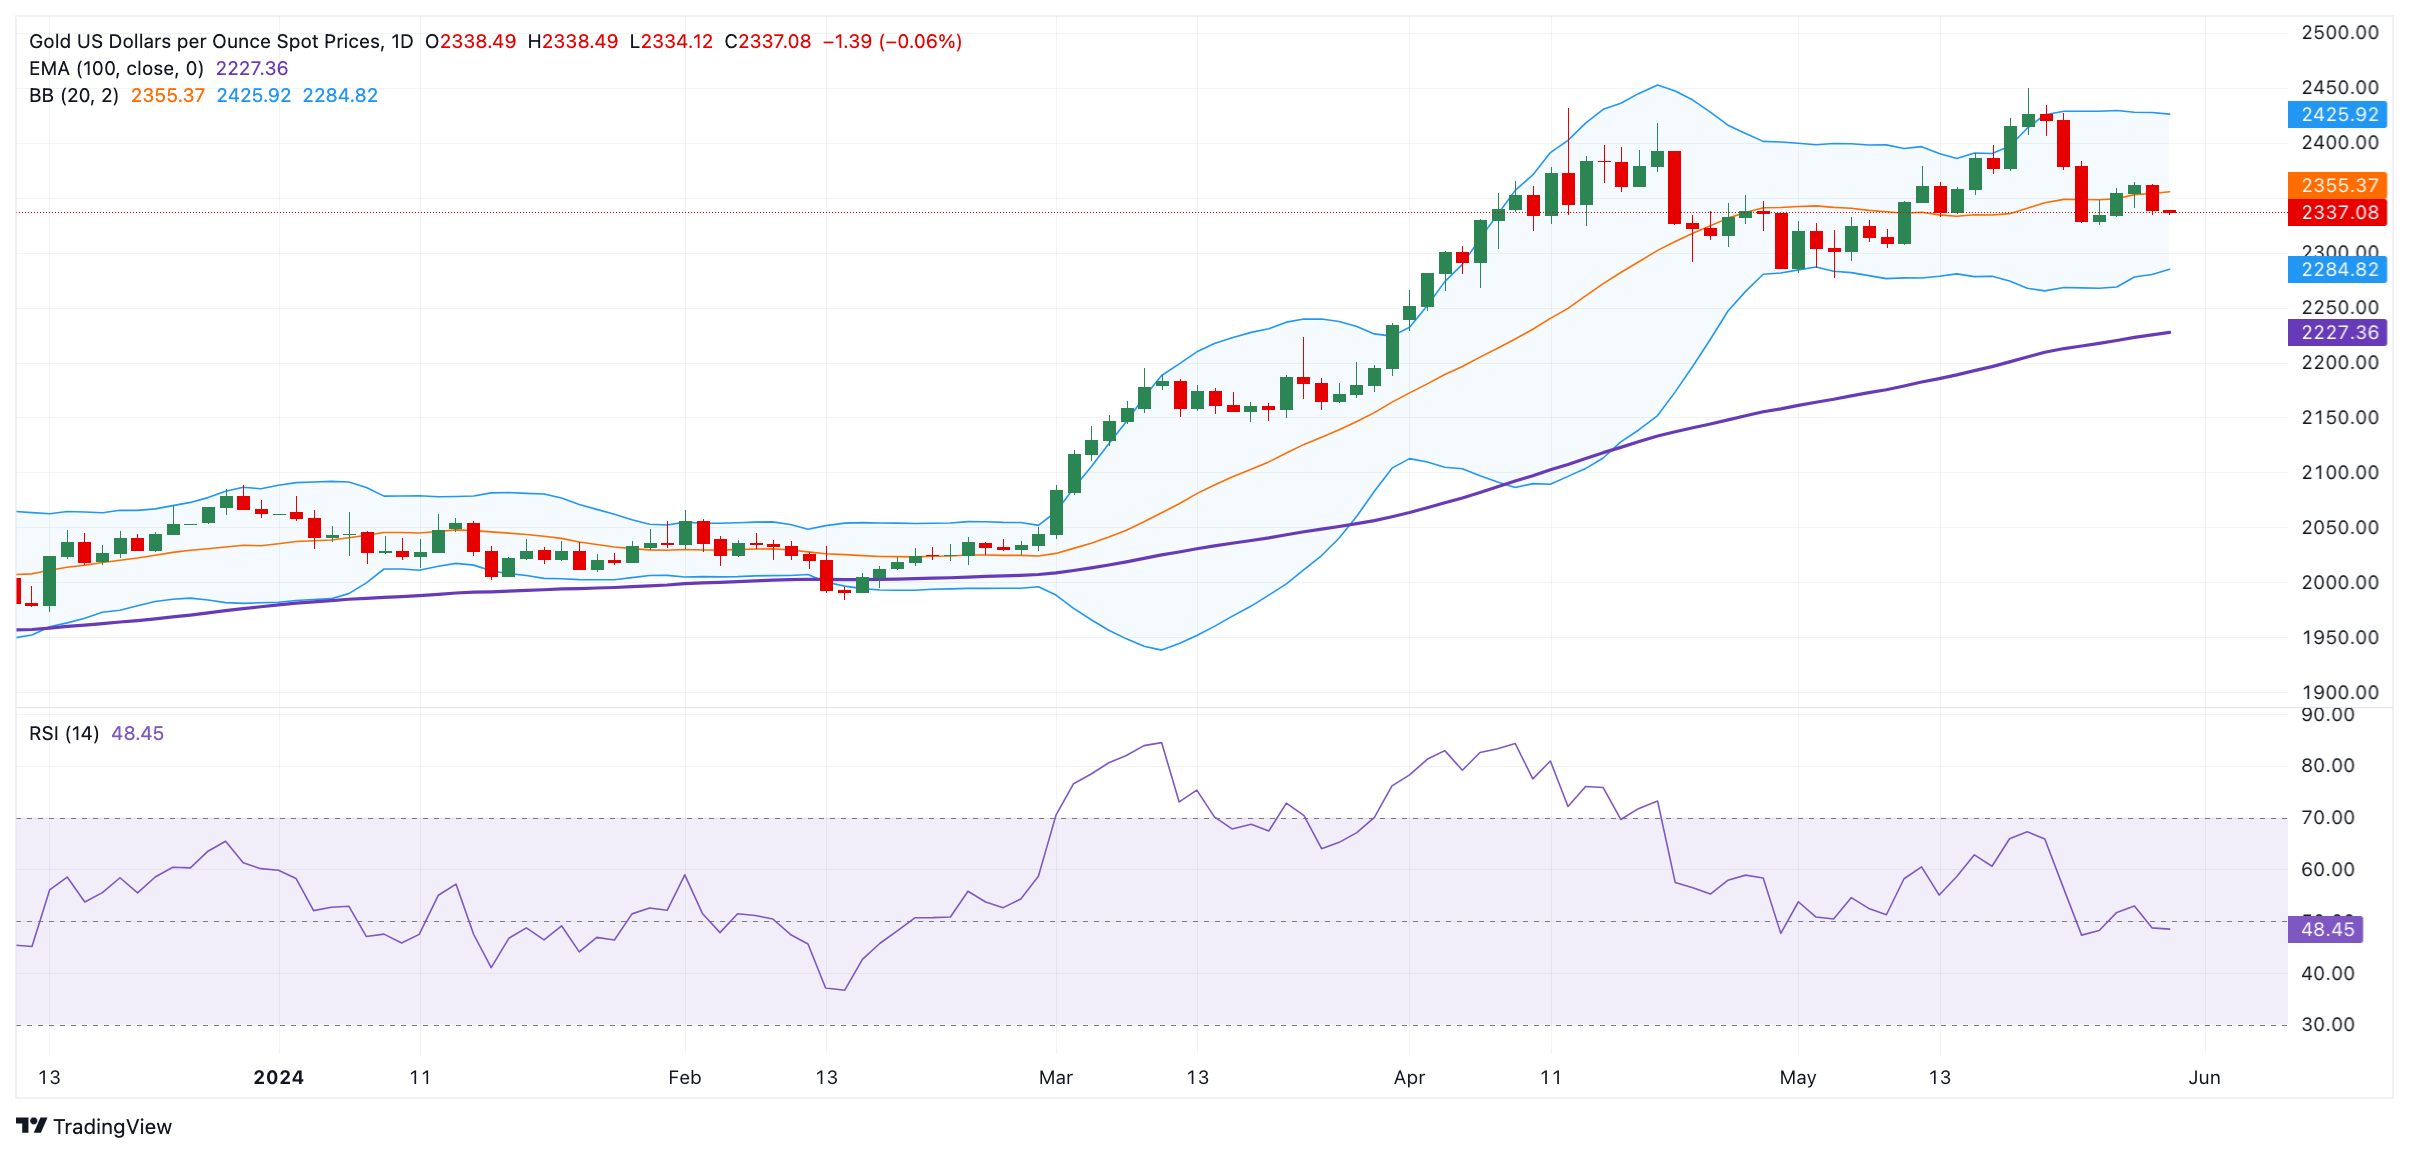
Technical analysis: Gold price keeps the bullish vibe in the long term
The gold price trades with negative bias on the day. According to the 1-hour chart, the precious metal stays bullish above the key 100-day Exponential Moving Average (EMA). However, the further consolidation or directionlessness of the yellow metal cannot be ruled out as the 14-day Relative Strength Index (RSI) hovers around the 50-midline, indicating a neutral level between bullish and bearish positions.
Extended gains above the upper boundary of the Bollinger Band at $2,425 might visit the all-time high of $2,450. An upside breakout above the mentioned level will pave the way to the $2,500 psychological mark.
On the downside, the first downside target of XAU/USD is located at a low of May 24 at $2,325. The potential support level will emerge at the $2,300 figure. A breach of this level will see a drop to the lower limit of the Bollinger Band at $2,284, followed by the 100-day EMA of $2,227.
US Dollar price in the last 7 days
The table below shows the percentage change of US Dollar (USD) against listed major currencies in the last 7 days. US Dollar was the strongest against the Japanese Yen.
| USD | EUR | GBP | CAD | AUD | JPY | NZD | CHF | |
| USD | 0.26% | 0.20% | 0.24% | 0.16% | 0.45% | -0.07% | -0.19% | |
| EUR | -0.26% | -0.06% | 0.00% | -0.09% | 0.21% | -0.33% | -0.45% | |
| GBP | -0.21% | 0.06% | 0.06% | -0.04% | 0.26% | -0.28% | -0.40% | |
| CAD | -0.25% | 0.00% | -0.05% | -0.09% | 0.21% | -0.33% | -0.45% | |
| AUD | -0.16% | 0.09% | 0.04% | 0.08% | 0.29% | -0.24% | -0.36% | |
| JPY | -0.45% | -0.20% | -0.28% | -0.20% | -0.31% | -0.54% | -0.66% | |
| NZD | 0.08% | 0.33% | 0.28% | 0.33% | 0.22% | 0.51% | -0.12% | |
| CHF | 0.20% | 0.45% | 0.39% | 0.45% | 0.36% | 0.65% | 0.12% |
The heat map shows percentage changes of major currencies against each other. The base currency is picked from the left column, while the quote currency is picked from the top row. For example, if you pick the Euro from the left column and move along the horizontal line to the Japanese Yen, the percentage change displayed in the box will represent EUR (base)/JPY (quote).
Fed FAQs
Monetary policy in the US is shaped by the Federal Reserve (Fed). The Fed has two mandates: to achieve price stability and foster full employment. Its primary tool to achieve these goals is by adjusting interest rates. When prices are rising too quickly and inflation is above the Fed’s 2% target, it raises interest rates, increasing borrowing costs throughout the economy. This results in a stronger US Dollar (USD) as it makes the US a more attractive place for international investors to park their money. When inflation falls below 2% or the Unemployment Rate is too high, the Fed may lower interest rates to encourage borrowing, which weighs on the Greenback.
The Federal Reserve (Fed) holds eight policy meetings a year, where the Federal Open Market Committee (FOMC) assesses economic conditions and makes monetary policy decisions. The FOMC is attended by twelve Fed officials – the seven members of the Board of Governors, the president of the Federal Reserve Bank of New York, and four of the remaining eleven regional Reserve Bank presidents, who serve one-year terms on a rotating basis.
In extreme situations, the Federal Reserve may resort to a policy named Quantitative Easing (QE). QE is the process by which the Fed substantially increases the flow of credit in a stuck financial system. It is a non-standard policy measure used during crises or when inflation is extremely low. It was the Fed’s weapon of choice during the Great Financial Crisis in 2008. It involves the Fed printing more Dollars and using them to buy high grade bonds from financial institutions. QE usually weakens the US Dollar.
Quantitative tightening (QT) is the reverse process of QE, whereby the Federal Reserve stops buying bonds from financial institutions and does not reinvest the principal from the bonds it holds maturing, to purchase new bonds. It is usually positive for the value of the US Dollar.