- Gold is rising on a revival of Chinese demand for the precious metal.
- Technically, XAU/USD trends sideways, with odds still favoring an eventual break higher given the broader uptrend.
Gold (XAU/USD) trades higher in the $2,520s on Thursday, gaining a lift from data showing demand from China increased in July – its first month of gains since March 2024.
Gold gains after report shows revival in China demand
Gold is probably gaining support after data from the World Gold Council (WGC) on Tuesday showed China’s net Gold imports rose by 17% in July, the first month of increases since March. A modest increase in net inflows of 8 metric tons ($403 million) led by North American funds last week, was also noted.
The precious metal may be benefiting from a slide in the US Dollar (USD), to which it is negatively correlated. The US Dollar Index (DXY) is pulling back down on Thursday and trading in the 100.90s, rolling over from a peak of 101.18 reached Wednesday.
Traders are now looking ahead to US Jobless Claims and Gross Domestic Product (GDP) data out on Thursday for more clarity on the projected path of US interest rates. The jobs data could be of particular relevance given the Chairman of the Federal Reserve (Fed) Jerome Powell highlighted risks to the labor market from keeping rates high at his Jackson Hole speech. The GDP data is a revision of the first estimate for Q2 with economists expecting it to remain steady at 2.8%. Negative macro data could spur Gold higher because it will suggest the Fed will need to bring interest rates down more quickly than previously thought. The promise of lower interest rates makes Gold more attractive to investors because it is a non-interest-paying asset.
Although a rate cut from the Fed at their September 18 meeting is already fully priced in by markets, the size of the cut is a matter for speculation. A 0.50% “mega cut” is still a possibility with the probabilities standing at around 34.5%, according to the CME FedWatch tool – little changed from the previous day.
Another barometer of the future course of interest rates, the December 2024 Chicago Board of Trade (CBOT) fed funds future rates contract, is pricing a total of 100 basis points of Fed cuts, or 1.00%, by the end of the year. With only three scheduled Fed meetings remaining on 2024’s calendar, this pricing implies a 0.50% interest-rate cut in at least one of them.
Friday could be a big day for Gold, however, as it is then that the Fed’s preferred gauge of inflation, the Personal Consumption Expenditures (PCE) Price Index, is released. Economists expect the core PCE inflation to rise to 2.7% in July from 2.6% in June YoY – a divergence from the estimate will impact Gold price. Higher inflation will weaken Gold by suggesting the Fed needs to keep interest rates elevated for longer; the opposite would be the case from a lower-than-expected result.
A risk to Gold price is extreme long positioning, according to Daniel Ghali, Senior Commodity Strategist at TD Securities, who claims the long trade is now overcrowded.
“Downside risks are now more potent. The ship is crowded. In fact, it has scarcely been as crowded as it is today. Do you have a slot secured on the lifeboat?” adds the strategist.
In fact, in a follow-up note on Thursday, TD Securities announced they are entering a tactical short position in the commodity, with an entry at $2,533, a target at $2,300, and a stop loss at $2,675.
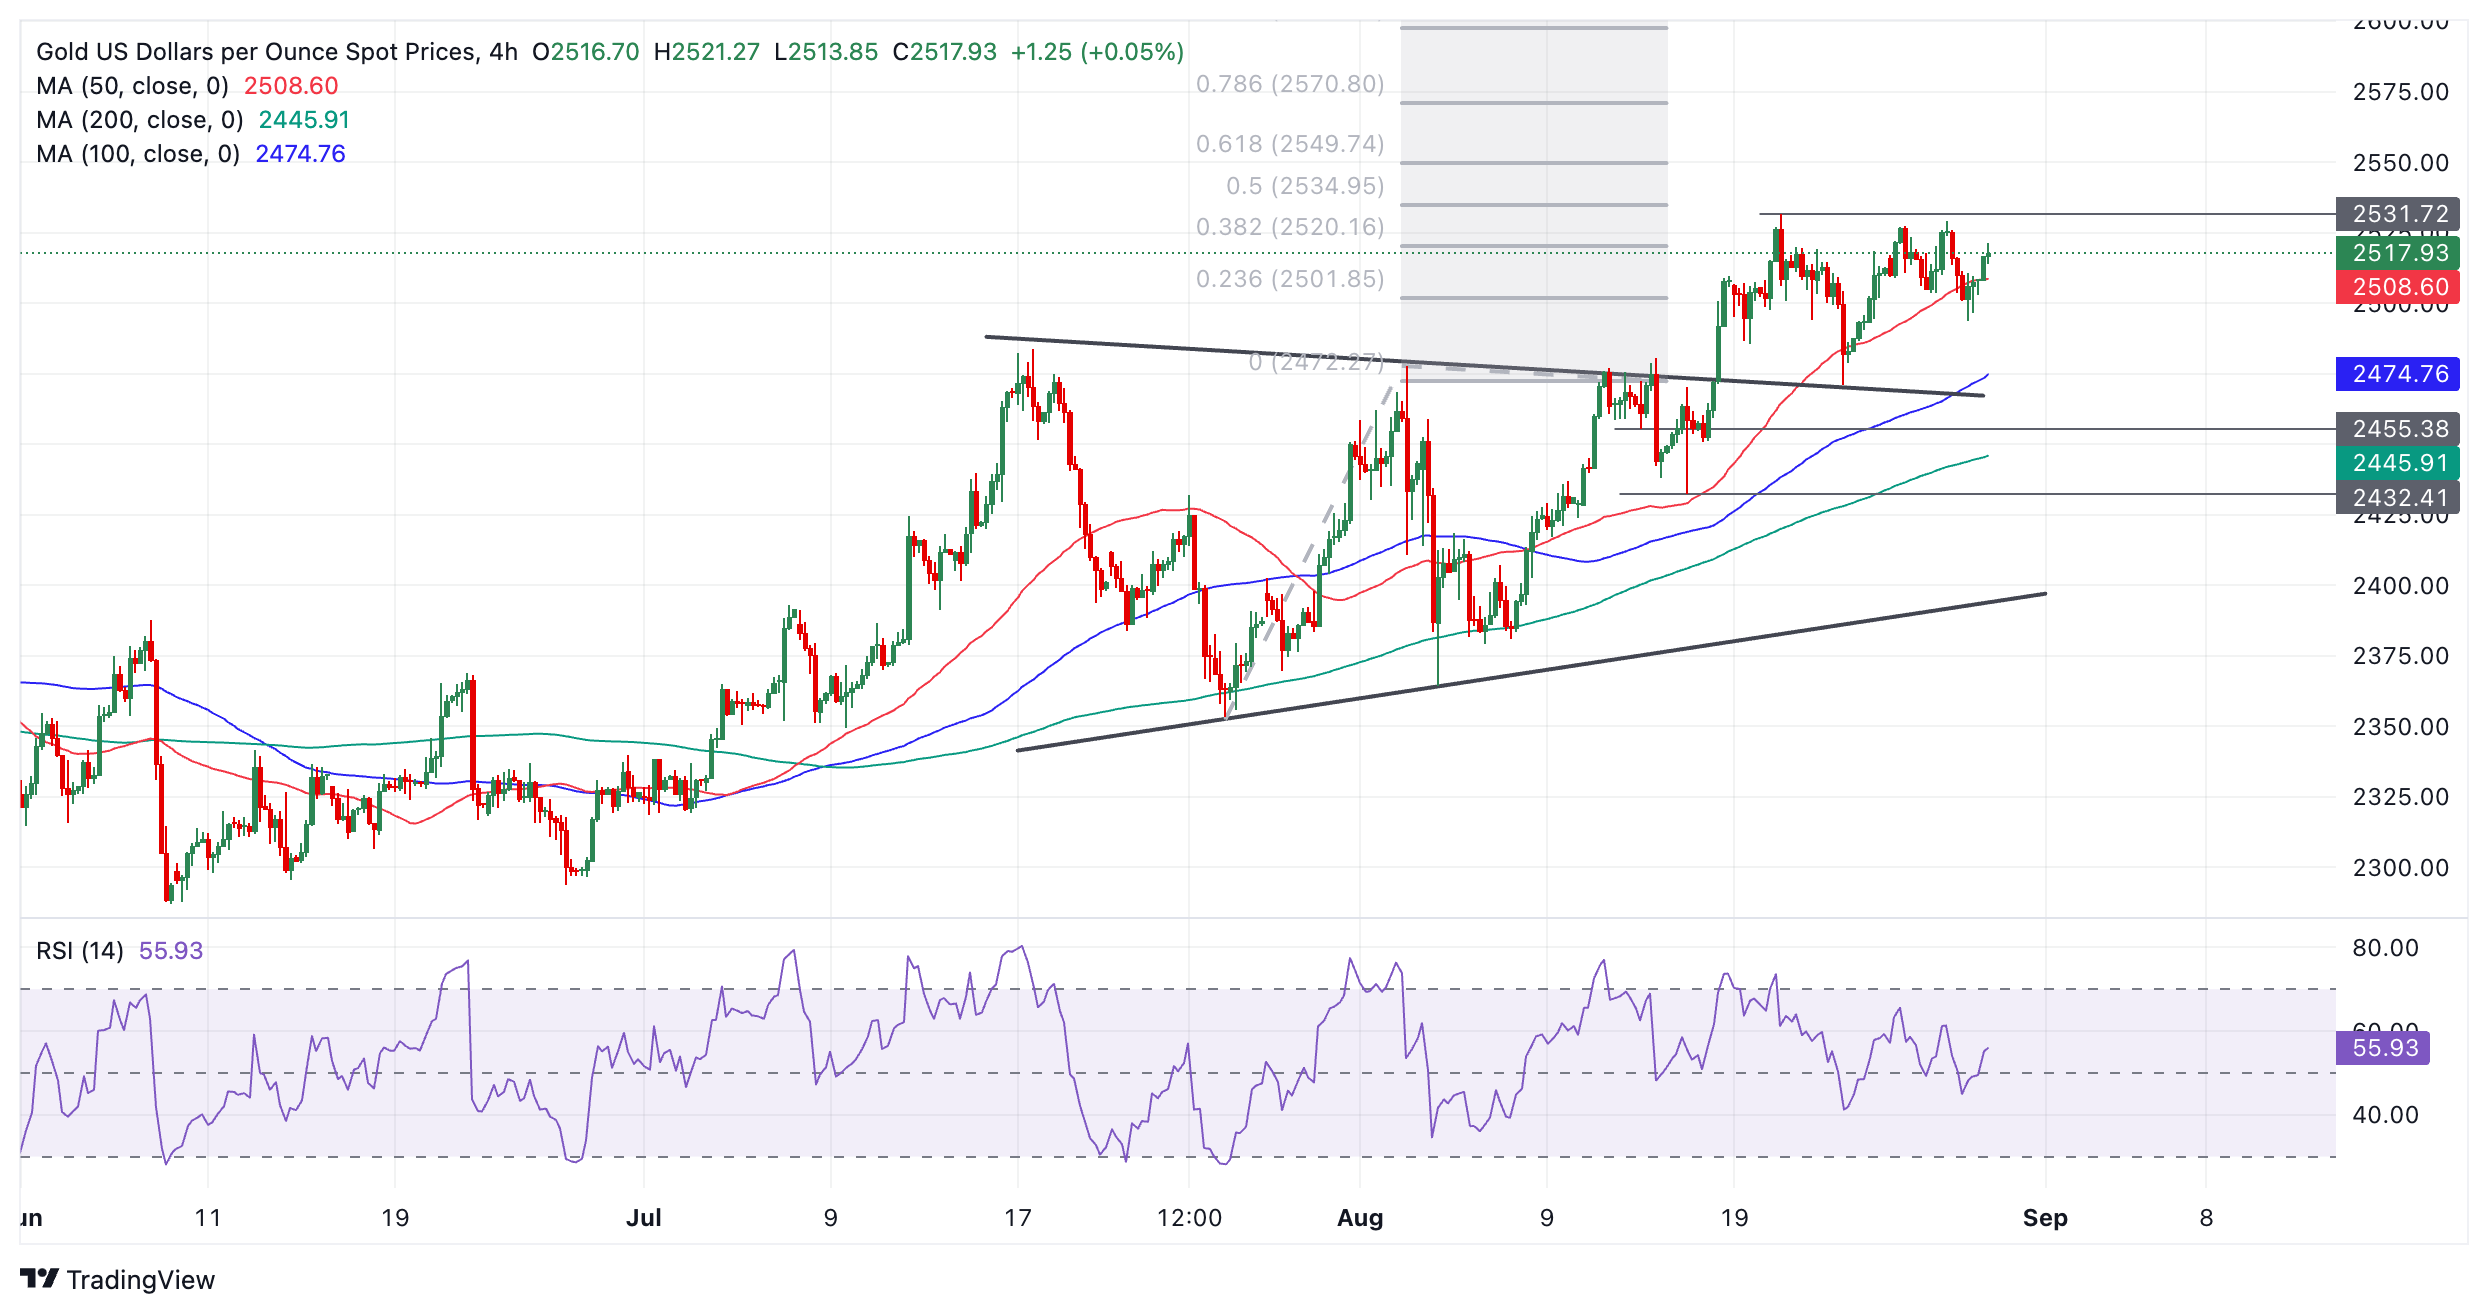
Technical Analysis: Mini-range between $2,500 and $2,531 extends
Gold (XAU/USD) is consolidating within a mini-range above its prior range. It is now debatable whether the short-term trend is still bullish – it could now be characterized as “sideways”.
Gold’s medium and long-term trends, however, remain bullish, which given “the trend is your friend,” means the odds favor an eventual breakout higher materializing.
XAU/USD 4-hour Chart

The breakout from the prior range (which also resembles an incomplete triangle pattern) that occurred on August 14 generated an upside target at roughly $2,550, calculated by taking the 0.618 Fibonacci ratio of the range’s height and extrapolating it higher. This target is the minimum expectation for the follow-through from a breakout based on principles of technical analysis.
A break above the $2,531 August 20 all-time high would provide confirmation of a continuation higher towards the $2,550 target.
Alternatively, a break back inside the range would negate the upside projected target. Such a move would be confirmed on a daily close below $2,470 (August 22 low). It would change the picture for Gold and suggest the commodity might be starting a short-term downtrend.
Economic Indicator
Initial Jobless Claims
The Initial Jobless Claims released by the US Department of Labor is a measure of the number of people filing first-time claims for state unemployment insurance. A larger-than-expected number indicates weakness in the US labor market, reflects negatively on the US economy, and is negative for the US Dollar (USD). On the other hand, a decreasing number should be taken as bullish for the USD.
Read more.
Next release: Thu Aug 29, 2024 12:30
Frequency: Weekly
Consensus: 232K
Previous: 232K
Source: US Department of Labor


