


- Mines of Dalarnia soars for a second consecutive session on Monday, breaking above the descending trendline.
- On-chain data shows that DAR’s daily active addresses are rising, and Exchange Flow Balance is falling, signaling a bullish move.
- A daily candlestick close below $0.136 would invalidate the bullish thesis.
Mines of Dalarnia (DAR), the native token of a blockchain-based game that combines elements of action, adventure, and strategy with decentralized finance (DeFi), is rising sharply for a second consecutive day on Monday. DAR, which soared by 57% over the weekend, is breaking above the descending trendline, signaling a bullish move ahead. Rising daily active addresses and a negative spike in exchange floor balances further suggest that the current rally still has some way to go.
Mines of Dalarnia price shows potential for a rally ahead
Mines of Dalarnia surged 57% on Sunday, retested, and faced resistance by the descending trendline (drawn by joining multiple daily close levels from mid-March). On Monday, it trades higher by 23% at $0.241 at the time of writing, breaking above the descending trendline, which signals a bullish move ahead.
If DAR breaks decisively above the descending trendline and closes above the weekly resistance at $0.238, it could rally 25% to restest its March 13 high of $0.299.
The Relative Strength Index (RSI) on the daily chart has spiked over 75, well into overbought levels. When the indicator enters overbought territory (+70), investors should stop adding to their long positions but keep existing long positions open since the asset price could still go higher. The Awesome Oscillator (AO) is on its way to flip above its neutral level of zero. For a bullish move to sustain, both momentum indicators should stay above their neutral levels.
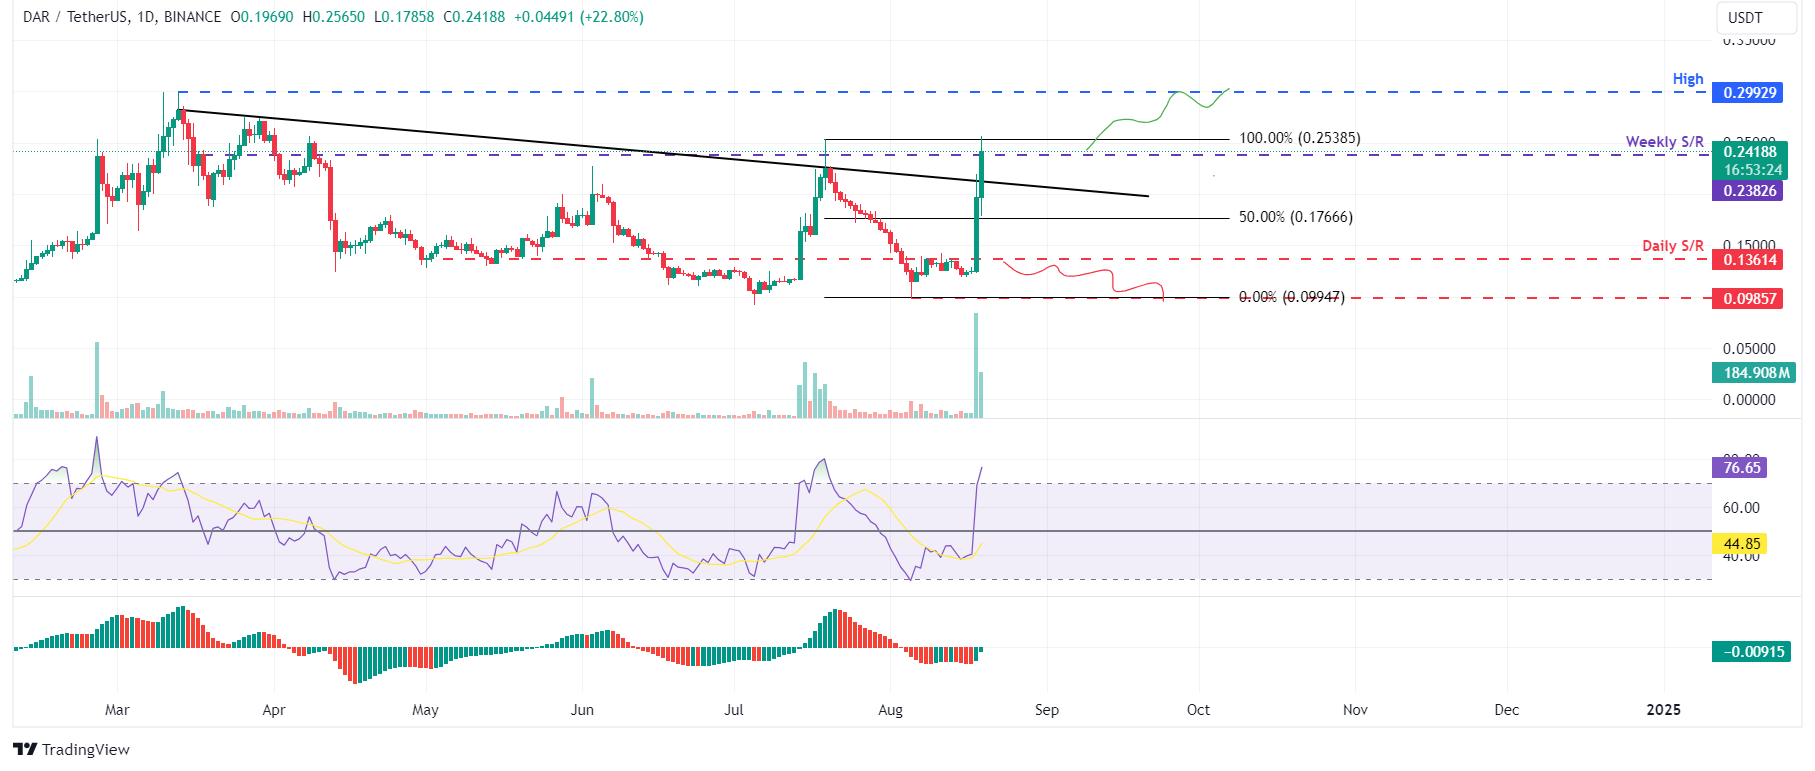
DAR/USDT daily chart
Santiment’s Exchange Flow Balance index shows the net movement of tokens into and out of exchanges. A positive spike indicates an inflow of tokens onto exchanges, suggesting selling pressure from investors. Conversely, a negative spike indicates an outflow of tokens from exchanges, indicating less selling pressure from investors.
In DAR’s case, the Exchange Flow balance declined from 40,283 to -3.42 million from Saturday to Sunday. This large negative spike generally suggests a decrease in selling activity.
In the same period, the supply on exchanges declined 2.5%, from 141.89 million to 138.46 million. This drop in supply indicates that investors are moving DAR tokens off exchanges to their wallets, decreasing the selling pressure. This is a bullish development, which further denotes investors’ confidence in the Mines of Dalarnia.
%20%5B10.49.41,%2019%20Aug,%202024%5D-638596496596333091.png)
DAR Exchange Floor Balance and Supply on Exchange chart
Additionally, Daily Active Addresses index data, which helps track network activity over time, aligns with the bullish outlook noted from a technical perspective. A rise in the metric signals greater blockchain usage, while declining addresses point to lower demand for the network.
In DAR’s case, Daily Active Addresses rose by 10% in one day, the highest since August 2. This indicates that the demand for DAR’s blockchain usage is increasing.
%20%5B10.49.12,%2019%20Aug,%202024%5D-638596497388983920.png)
DAR Daily Active Addresses chart
Despite the bullish thesis signaled by both on-chain data and technical analysis, the outlook will shift to bearish if DAR’s daily candlestick closes below the $0.136 daily support level. This scenario could lead to a 26% crash to retest its August 5 low of $0.099.