


- Sui price faced rejection from its all-time high of $2.18 on Monday, hinting at a decline ahead.
- Technical analysis shows that SUI has formed a bearish divergence on a momentum indicator.
- A daily candlestick close above $2.18 would invalidate the bearish thesis.
Sui (SUI) price extends its decline on Wednesday after being rejected from its all-time high of $2.18 on Monday. Technical analysis further supports a short-term decline, as the formation of a bearish divergence on a momentum indicator suggests weakening upward momentum.
Sui price shows signs of weakness
Sui price was rejected from its all-time high of $2.18 on Monday after three straight weeks of rallying over 70%, and it declined slightly the next day. At the time of writing on Wednesday, it continues to trade down around $1.90. If this resistance level at $2.18 holds, Sui’s price could extend the decline by 27% to tag $1.38, its daily support level.
Moreover, the Relative Strength Index (RSI) indicator supports this bearish thesis in the daily chart. The higher high in SUI’s price formed on Monday does not reflect the RSI lower high for the same period. This development is termed a bearish divergence and often leads to a reversal of the trend or a short-term crash.
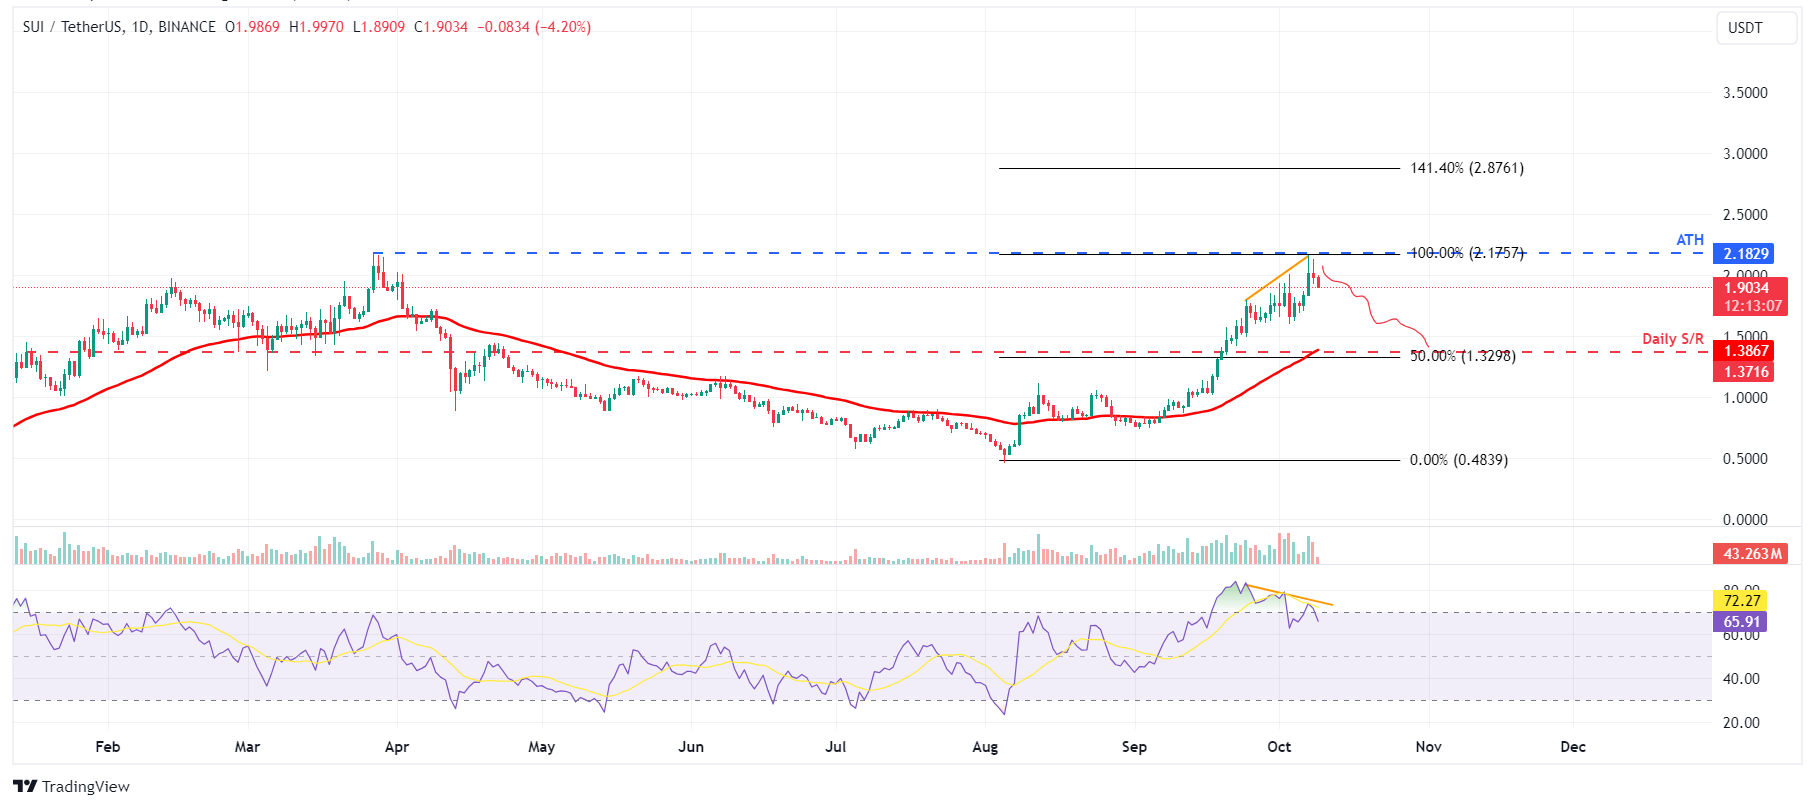
SUI/USDT daily chart
However, the bearish thesis would be invalidated if the SUI price breaks and closes above $2.18. This scenario could lead to a rally in Sui’s price to form a new all-time high of $2.87, the 141.40% Fibonacci extension level drawn from an early August low of $0.48 to an early October high of $2.17.