


- Hyperliquid rallies to a new all-time high of around $43.00 and retreats slightly afterward.
- HYPE futures Open Interest soars to $1.89 billion, a 34% increase in June.
- The recovery of the MFI indicator above the 50 midline indicates elevated interest in HYPE despite prices touching all-time highs.
Hyperliquid (HYPE) has, at least since the April 7 tariff-triggered crash that saw it drop to $9.37, surged nearly 400% to trade near $41.33 at the time of writing on Wednesday. The high-performance Layer-1 protocol, optimized for user-built applications, has retraced slightly from the all-time high achieved near $43.00, suggesting potential profit-taking. The lethargic sentiment currently in the market follows the recently concluded trade talks between top officials from the United States (US) and China.
Hyperliquid Open Interest surge could bolster price discovery
The persistent increase in HYPE futures contracts Open Interest (OI) hit a new all-time high of $1.89 billion, representing a 34% growth from June 1. A subsequent increase in trading volume to $2.16 billion, according to CoinGlass data, indicates heightened market activity and interest in the token.
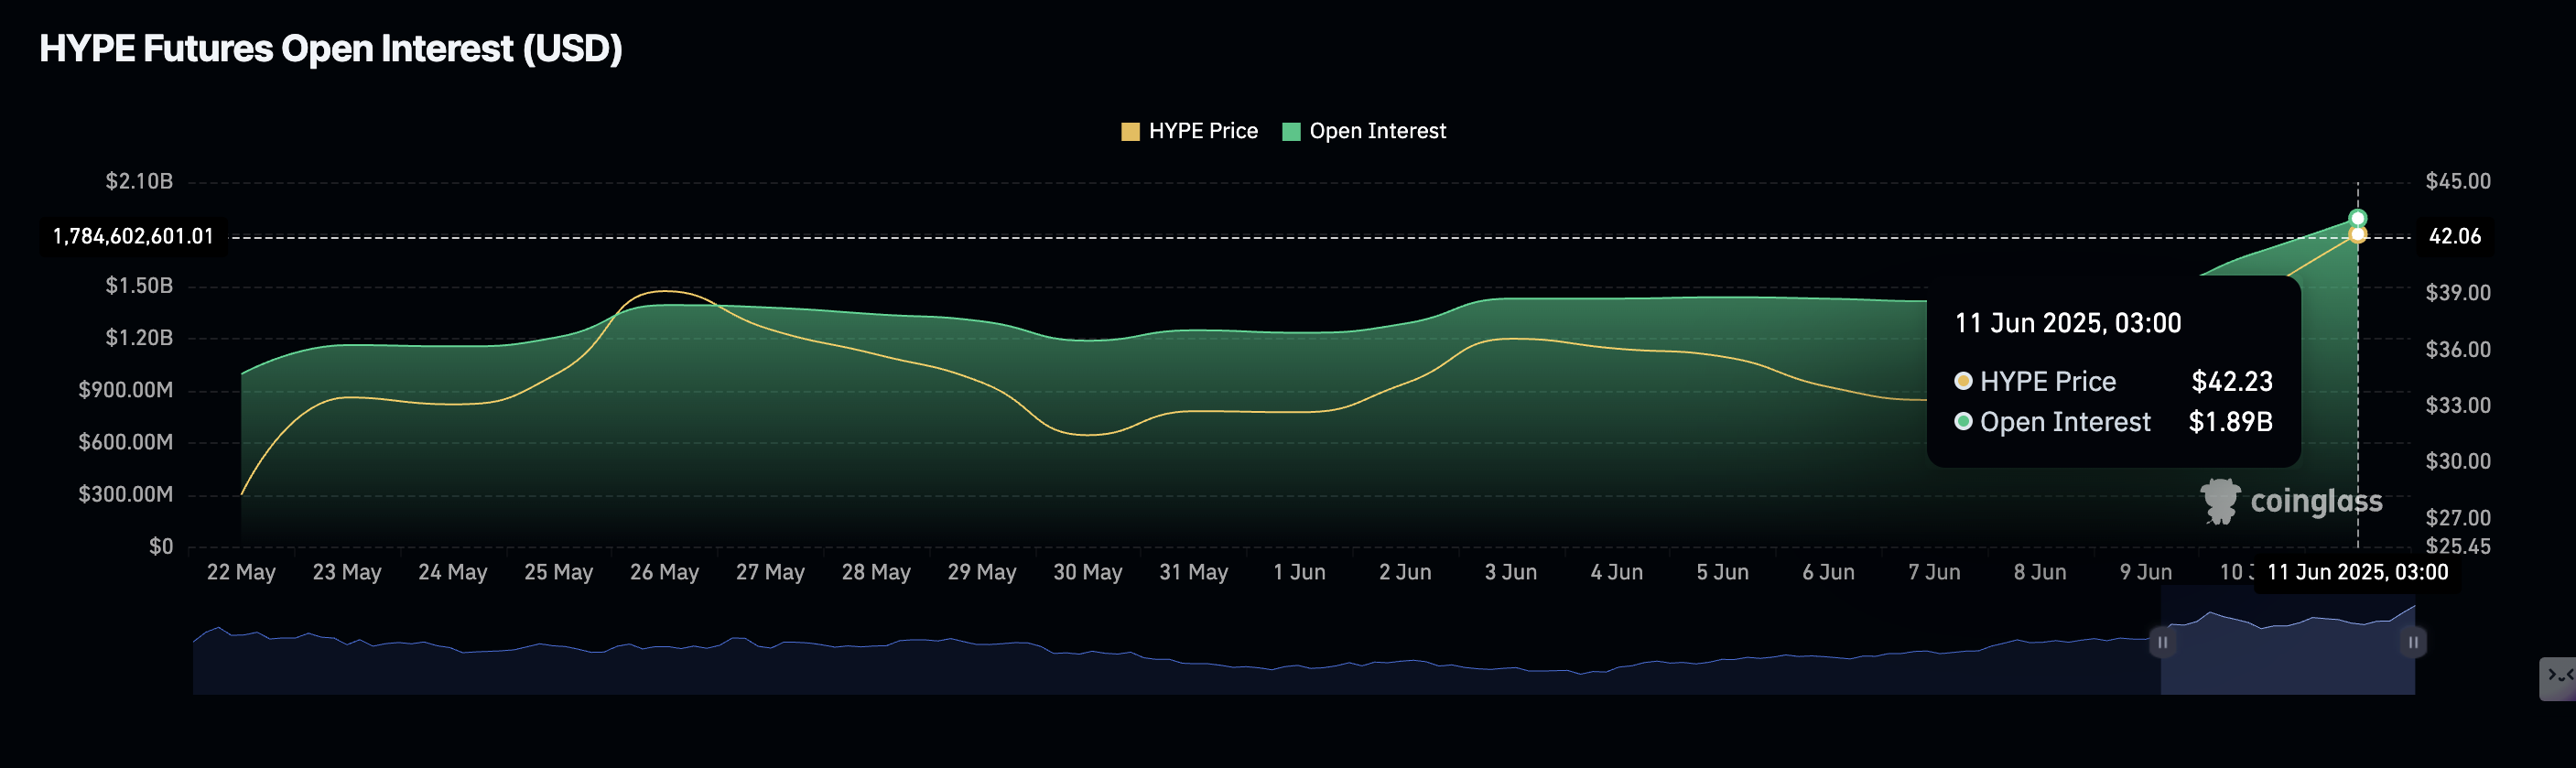
Hyperliquid futures open interest | Source: CoinGlass
OI refers to the number of outstanding futures and options contracts that are yet to be settled or closed. A long-to-short ratio of 1.0367 signals that traders have a bullish bias and are likely betting on the potential extension of the price discovery mode.
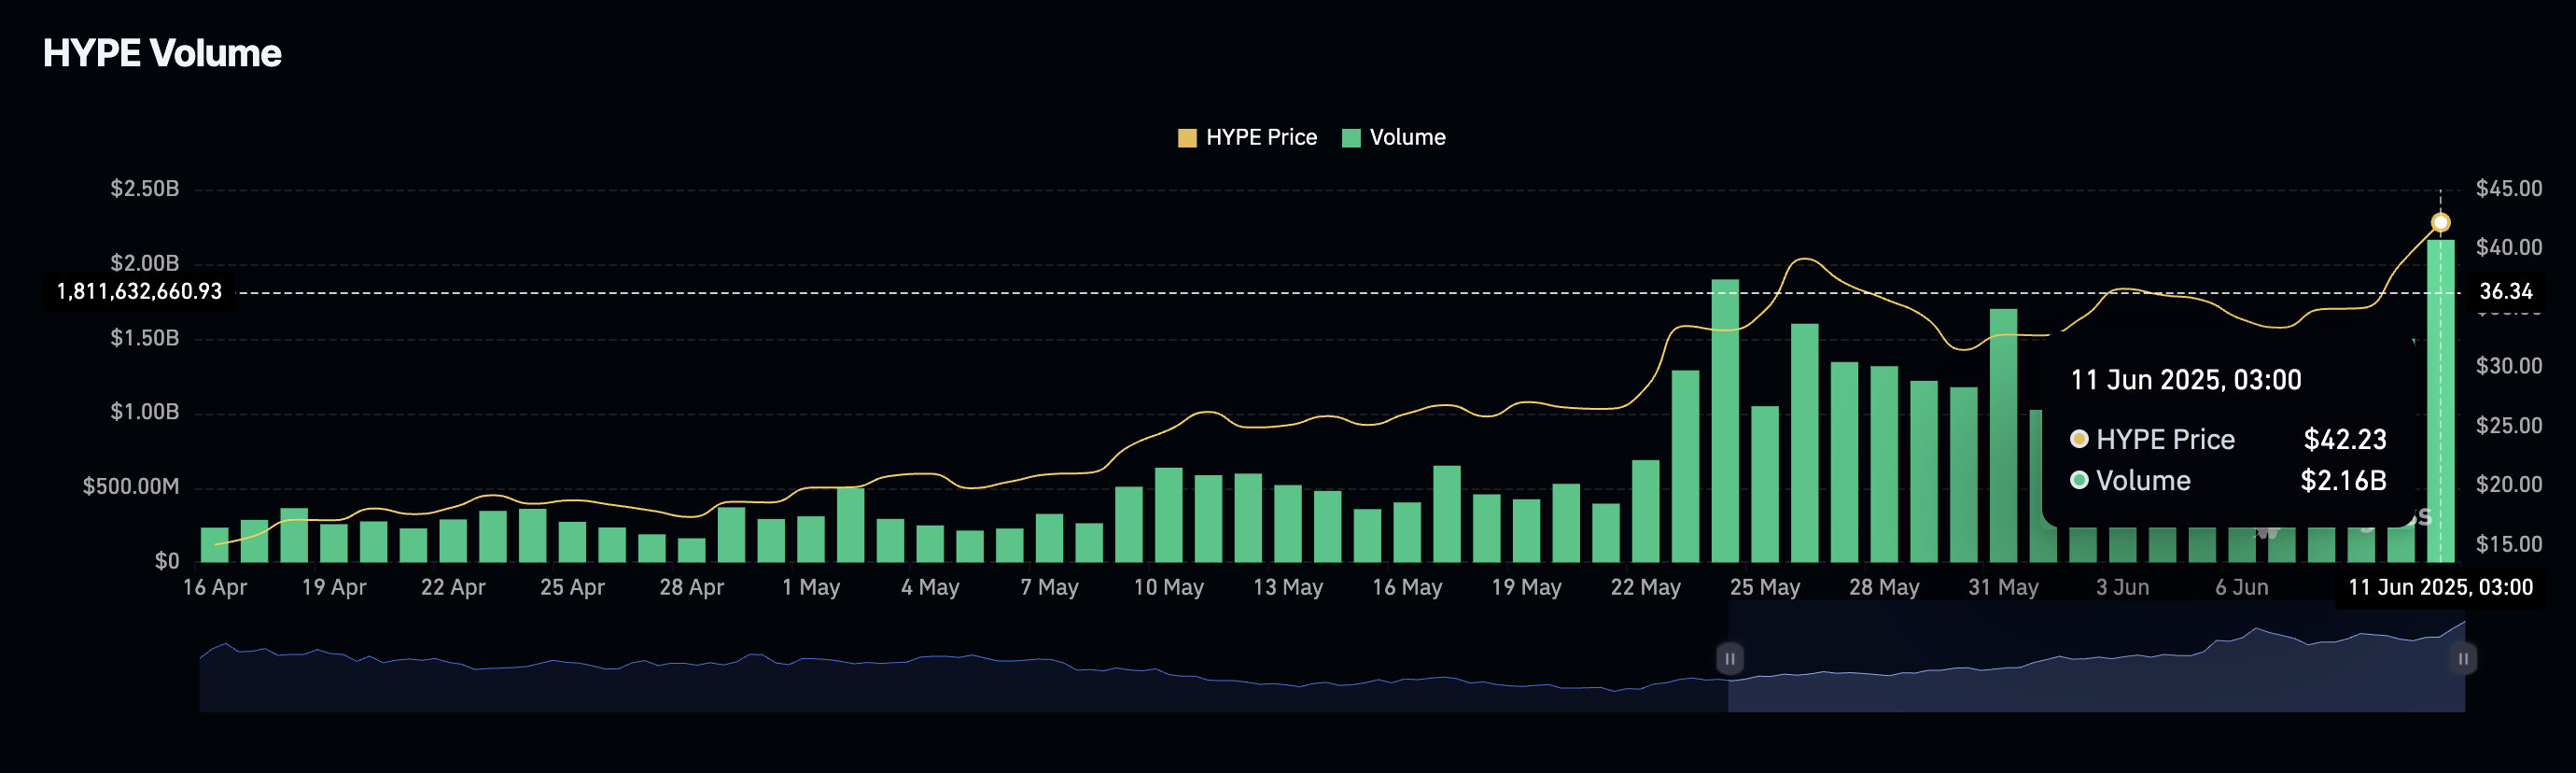
Hyperliquid futures trading volume | Source: CoinGlass
Hyperliquid technical outlook: Can bulls uphold the uptrend near all-time highs?
Hyperliquid’s price exchanges hands at $41.33 at the time of writing, down nearly 2.5% on the day. The pullback from the record high reflects subdued sentiment in the broader crypto market as the US-China trade framework reached in London on Tuesday failed to move prices upward.
Despite the slight correction, Hyperliquid appears to be holding support at $40.00, reinforced by a buy signal flashed by the Moving Average Convergence Divergence (MACD) indicator on Tuesday.
This signal, which often encourages traders to seek exposure to HYPE, occurred after the blue MACD line crossed above the red signal line. The green histogram bars above the mean line (0.00) show that bulls still have the upper hand and could push Hyperliquid to new highs above $43.00.
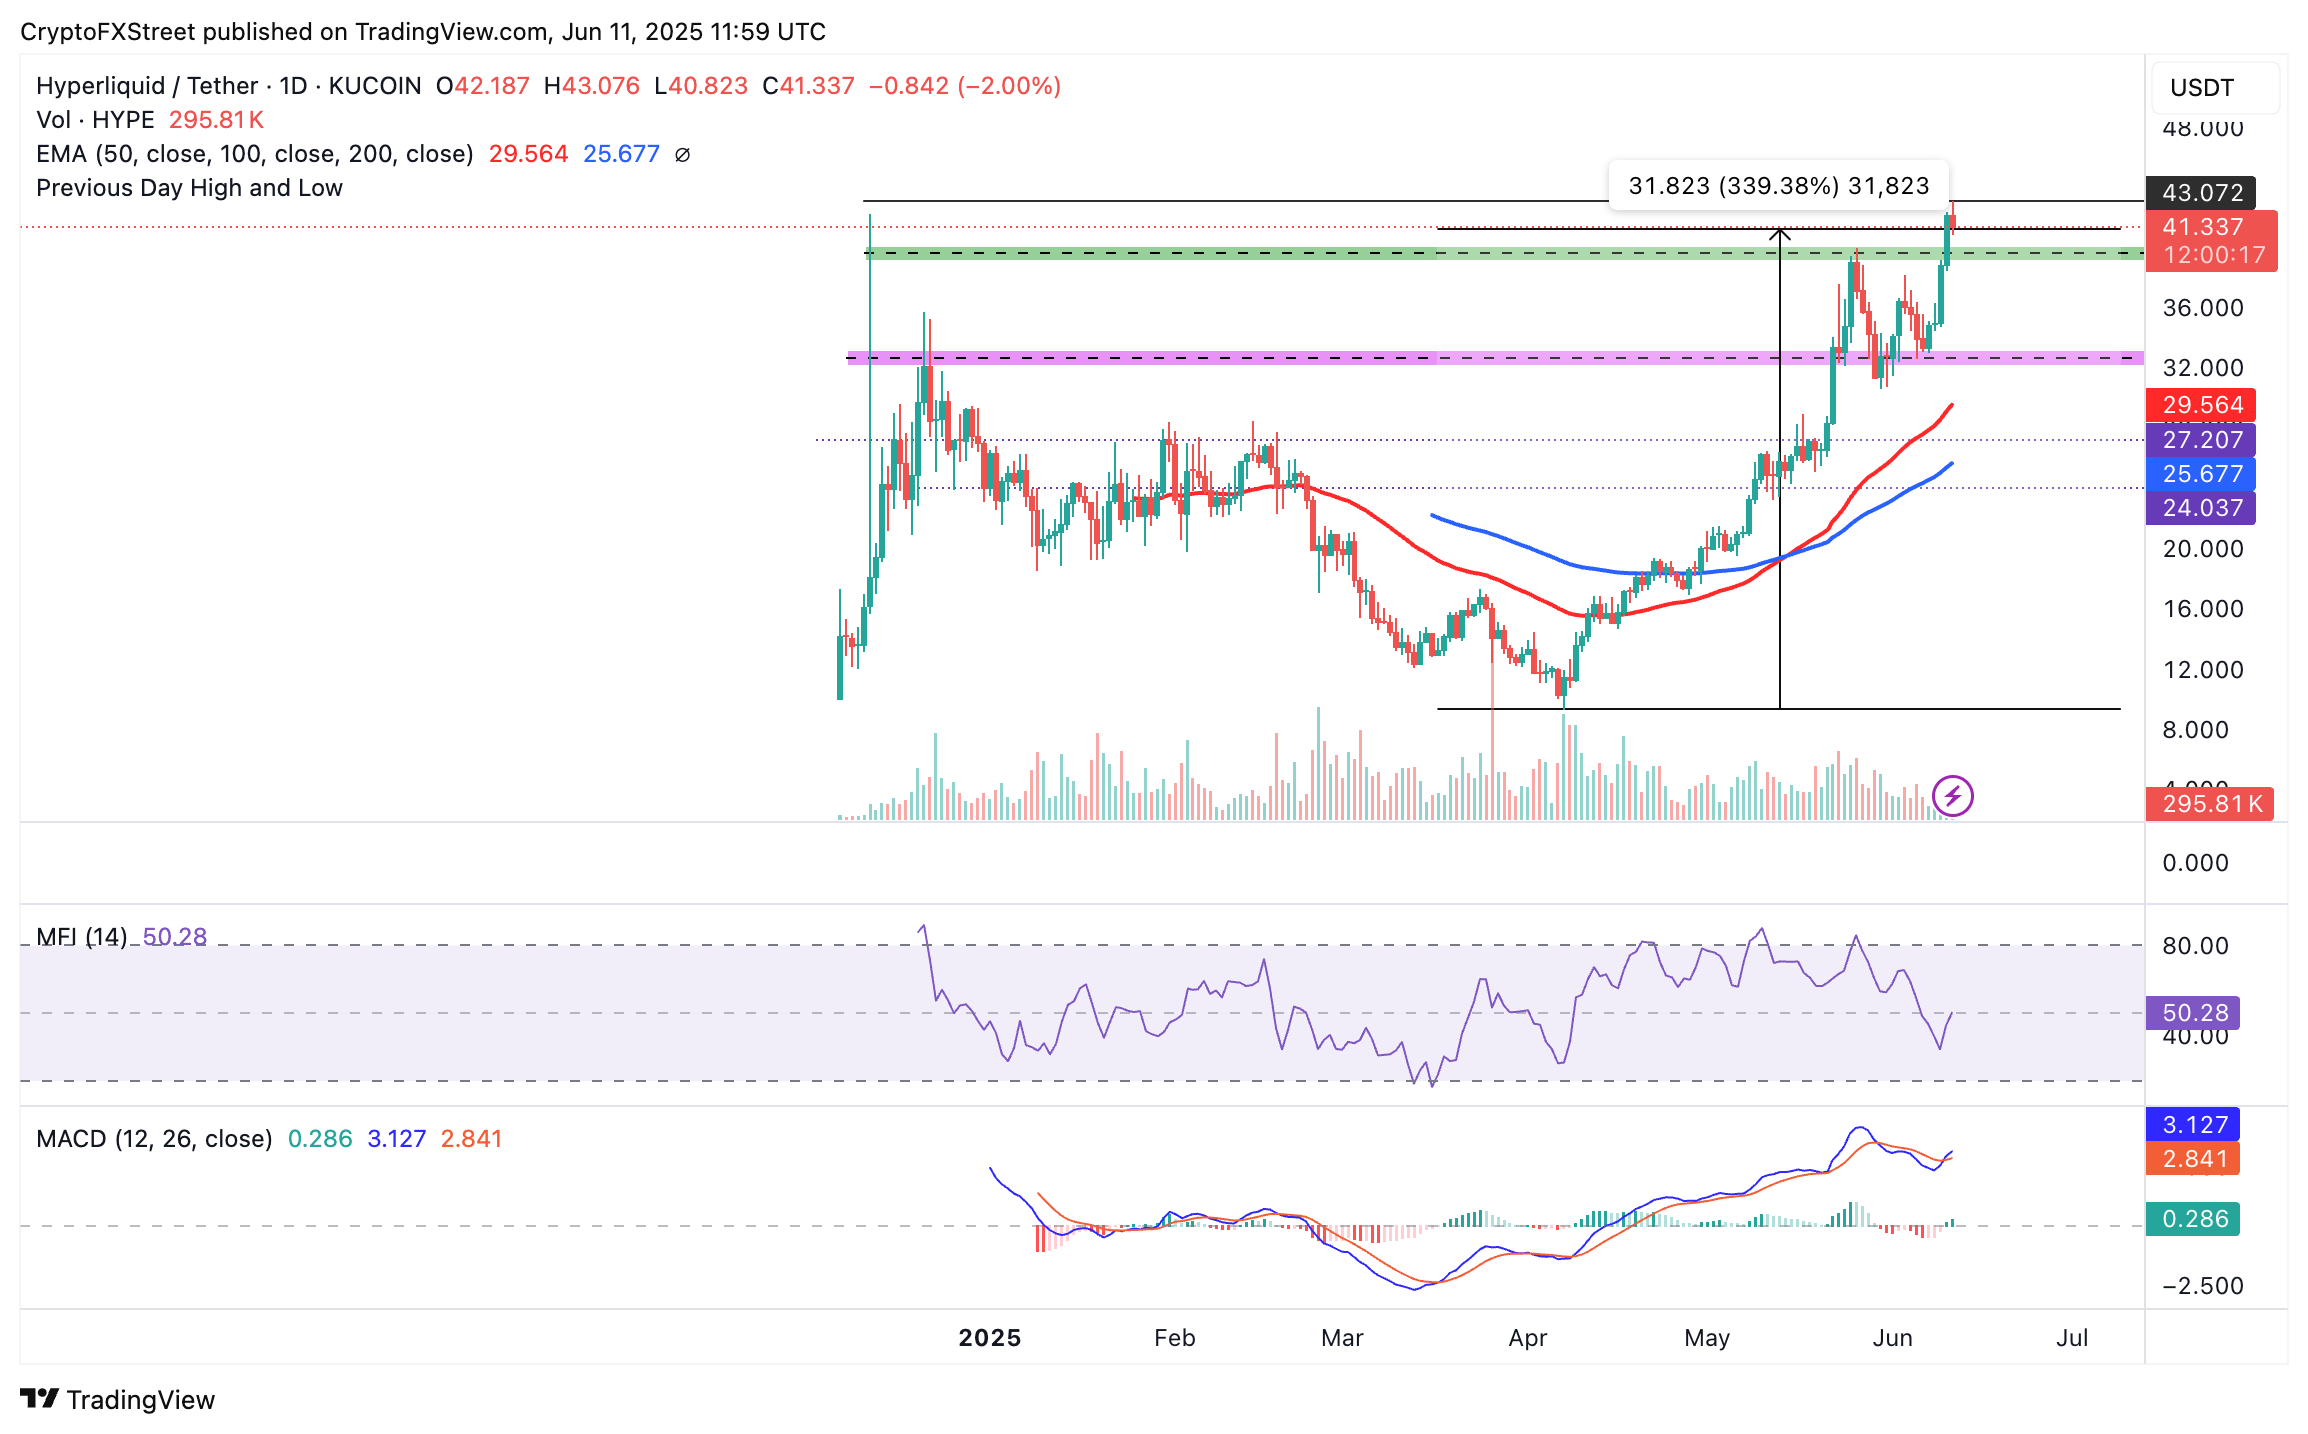
HYPE/USD daily chart
The Money Flow Index (RSI) indicator, which measures the amount of money in and out of HYPE, has recovered above the 50 midline, signaling rising interest in the token.
Furthermore, HYPE sits significantly above key moving averages, including the 50-day Exponential Moving Average (EMA) at $29.56 and the 100-day EMA at $25.67, which bolster the bullish structure.
Still, traders may want to temper their bullish expectations if resistance at $43.00 remains intact amid potential profit-taking and shifting market dynamics in the broader cryptocurrency market. A reversal below the short-term support at $40.00 could create instability, highlighting bearish momentum while bringing lower levels, such as $36 and $32, into sight.