
- Solana price has plunged below $190 and hit 20-day lows on Monday, down over 15% in the first three days of February.
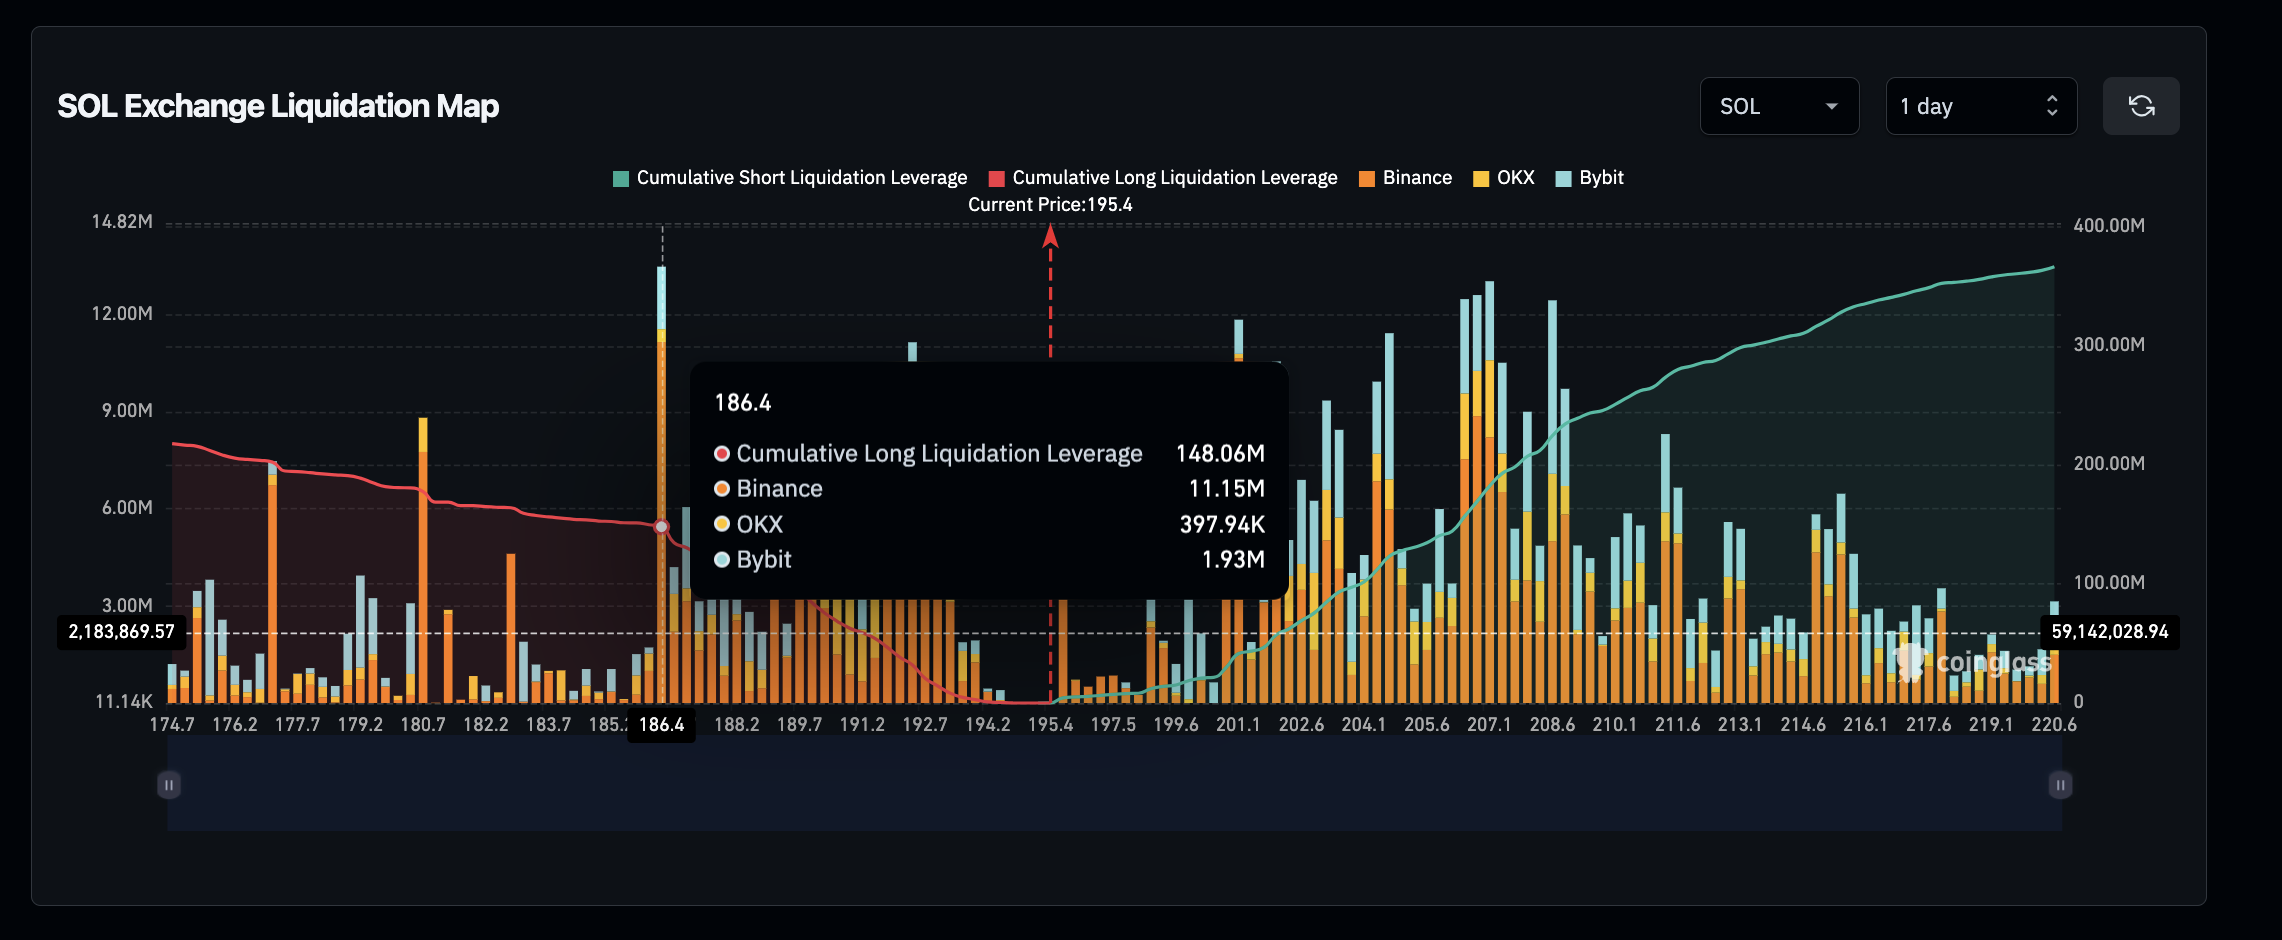
- SOL’s strongest support level lies at $186, with bulls clustering 68% of the $231 million total long leverage positions at that price.
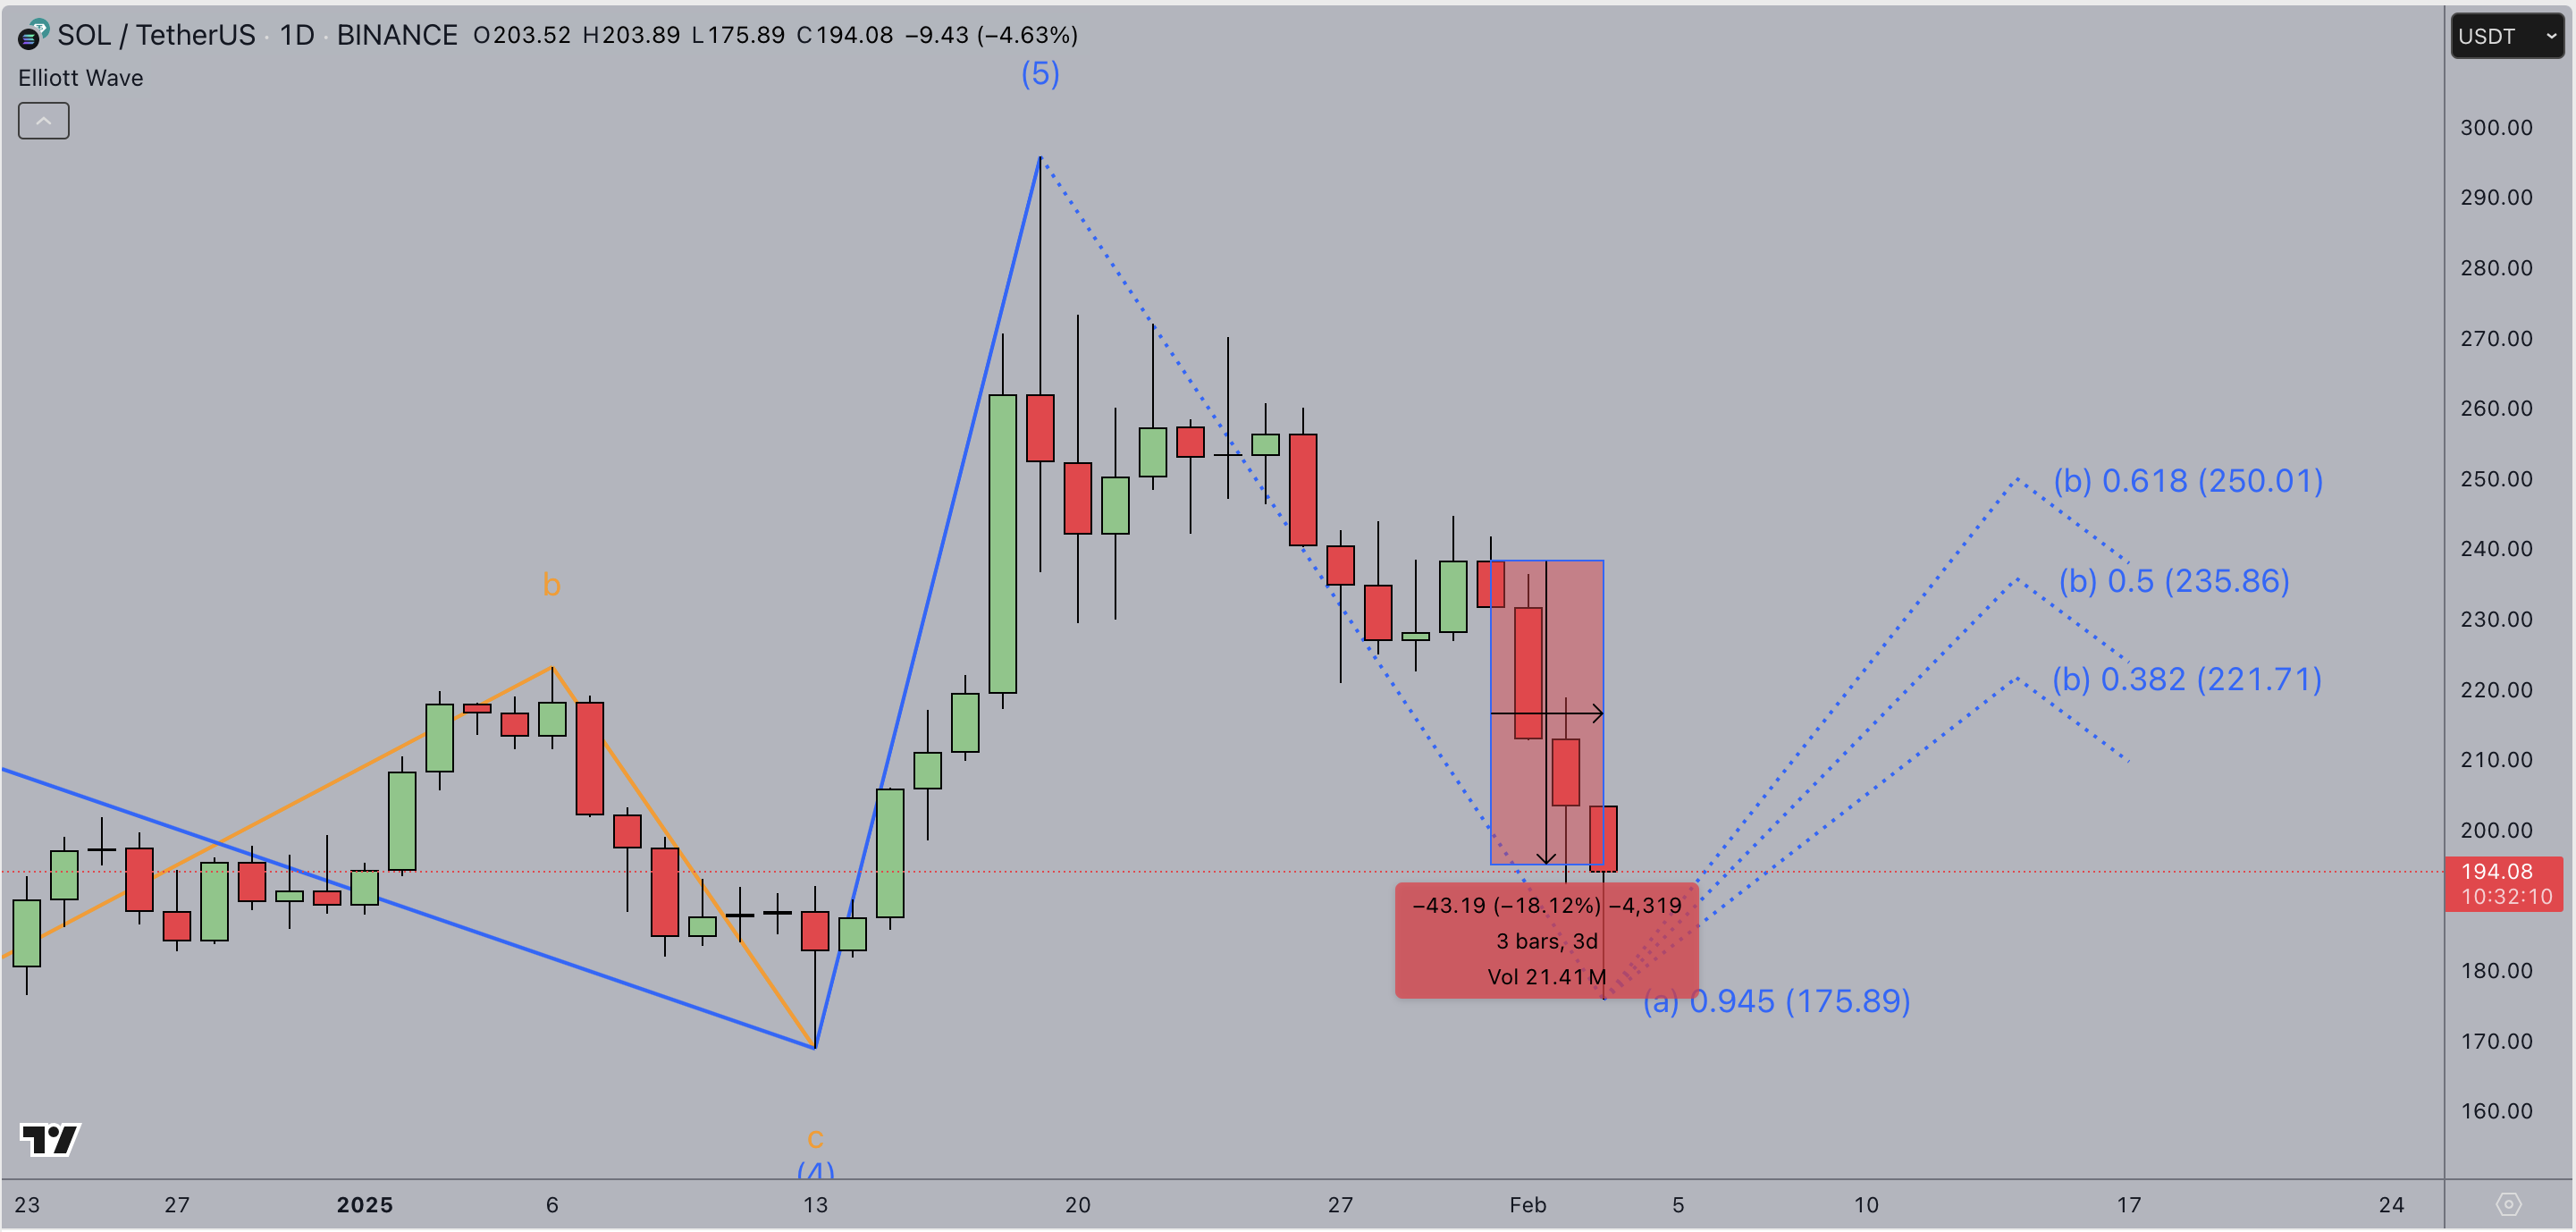
- The Elliott Wave analysis suggests a recovery path toward $250 if market sentiment swings positive.
Solana’s price has experienced an 18% downswing in the last three days, trading as low as $195 on Monday. Trading indicators highlight key levels to watch as SOL bulls attempt a recovery.
$150M leverage hints SOL’s strongest support level lies at $186
The recent downturn in Solana’s price action has raised concerns among traders, with SOL slipping below the $200 mark for the first time in three weeks. This sharp correction comes amid heightened volatility across the crypto markets, influenced by macroeconomic uncertainty and reduced risk appetite among investors.
Data from Coinglass provides a clear snapshot of key price levels where most short-term traders have concentrated their leverage positions.
The liquidation heatmap reveals that SOL’s strongest support level is at $186, with a significant 68% of the $217 million total long positions clustered at this price point. Before this level, other notable support zones include $189 and $192, where $38 million and $94 million in leveraged long positions have been mounted, respectively.
Solana Liquidation Map | Coinglass
These clusters of high-leverage positions indicate areas where traders may strongly defend their positions to avoid liquidation, creating localized demand zones.
If SOL extends its decline toward these support levels, bulls could stage a strong defense, potentially stabilizing prices before a rebound attempt.
However, failure to hold above $186 could expose Solana to deeper losses, with the next major demand zone appearing around $175.
Despite this bearish pressure, technical indicators suggest a potential recovery if broader market sentiment shifts.
The Bollinger Bands show that SOL is currently trading near its lower boundary, indicating an oversold condition. This suggests a potential relief rally in the near term, provided external market factors do not trigger further sell-offs.
Elliott Wave technical pattern highlights Solana’s path towards a $250 breakout
While short-term market conditions remain fragile, the Elliott Wave pattern suggests a bullish recovery could be on the horizon.
Historical wave structures indicate that SOL is currently in a corrective phase, potentially completing wave four of a five-wave cycle.
If this analysis holds, Solana could be poised for a wave-five extension targeting $250.
The key to this bullish breakout lies in market sentiment and volume dynamics. A decisive move above $200, coupled with increasing volume, could validate this Elliott Wave projection. Additionally, traders will closely monitor the $217 level, which represents a significant resistance point where short positions have accumulated.
A breakout above this threshold could accelerate SOL’s ascent towards the psychological $250 target.
Solana Price Forecast Chart | TradingView
Moreover, institutional interest in Solana remains a strong underlying catalyst. The approval of a Litecoin ETF has sparked speculation about potential Solana-based investment products, further strengthening the asset’s long-term outlook. If institutional capital flows into SOL in anticipation of broader crypto ETF adoption, the asset could experience a significant repricing event, similar to Bitcoin and Ethereum in prior ETF cycles.
In the short term, traders will watch key Fibonacci retracement levels for signs of reversal. The 38.2% retracement level at $205 remains a crucial pivot point, with a sustained close above this mark potentially signaling the beginning of an uptrend. Meanwhile, momentum indicators such as the RSI and MACD suggest that selling pressure is waning, further supporting the case for a bullish turnaround.
Ultimately, while Solana’s price remains under pressure due to macroeconomic headwinds, technical indicators point to a potential recovery if key support levels hold. The Elliott Wave pattern, combined with rising institutional interest, suggests that SOL could be setting up for a major breakout towards $250 in the coming weeks.