


- Dogecoin eyes February lows after nearly 23% decline in the past seven days.
- Shiba Inu could plummet another 13% amid the broader crypto market correction.
- Bonk price is likely to regain lost ground as technical indicators point at recovery.
Crypto markets are suffering a market-wide correction, with Bitcoin (BTC), Ethereum (ETH) and XRP prices down 14%, 12% and 10%, respectively, in the past seven days. In the same time frame, meme coins Dogecoin (DOGE), Shiba Inu (SHIB) and Bonk (BONK) suffered an even steeper correction, accumulating losses of more than 20% each.
The technical picture of the top three meme coins suggests that while DOGE and SHIB are likely to extend the recent decline, BONK is showing some signs of recovery.
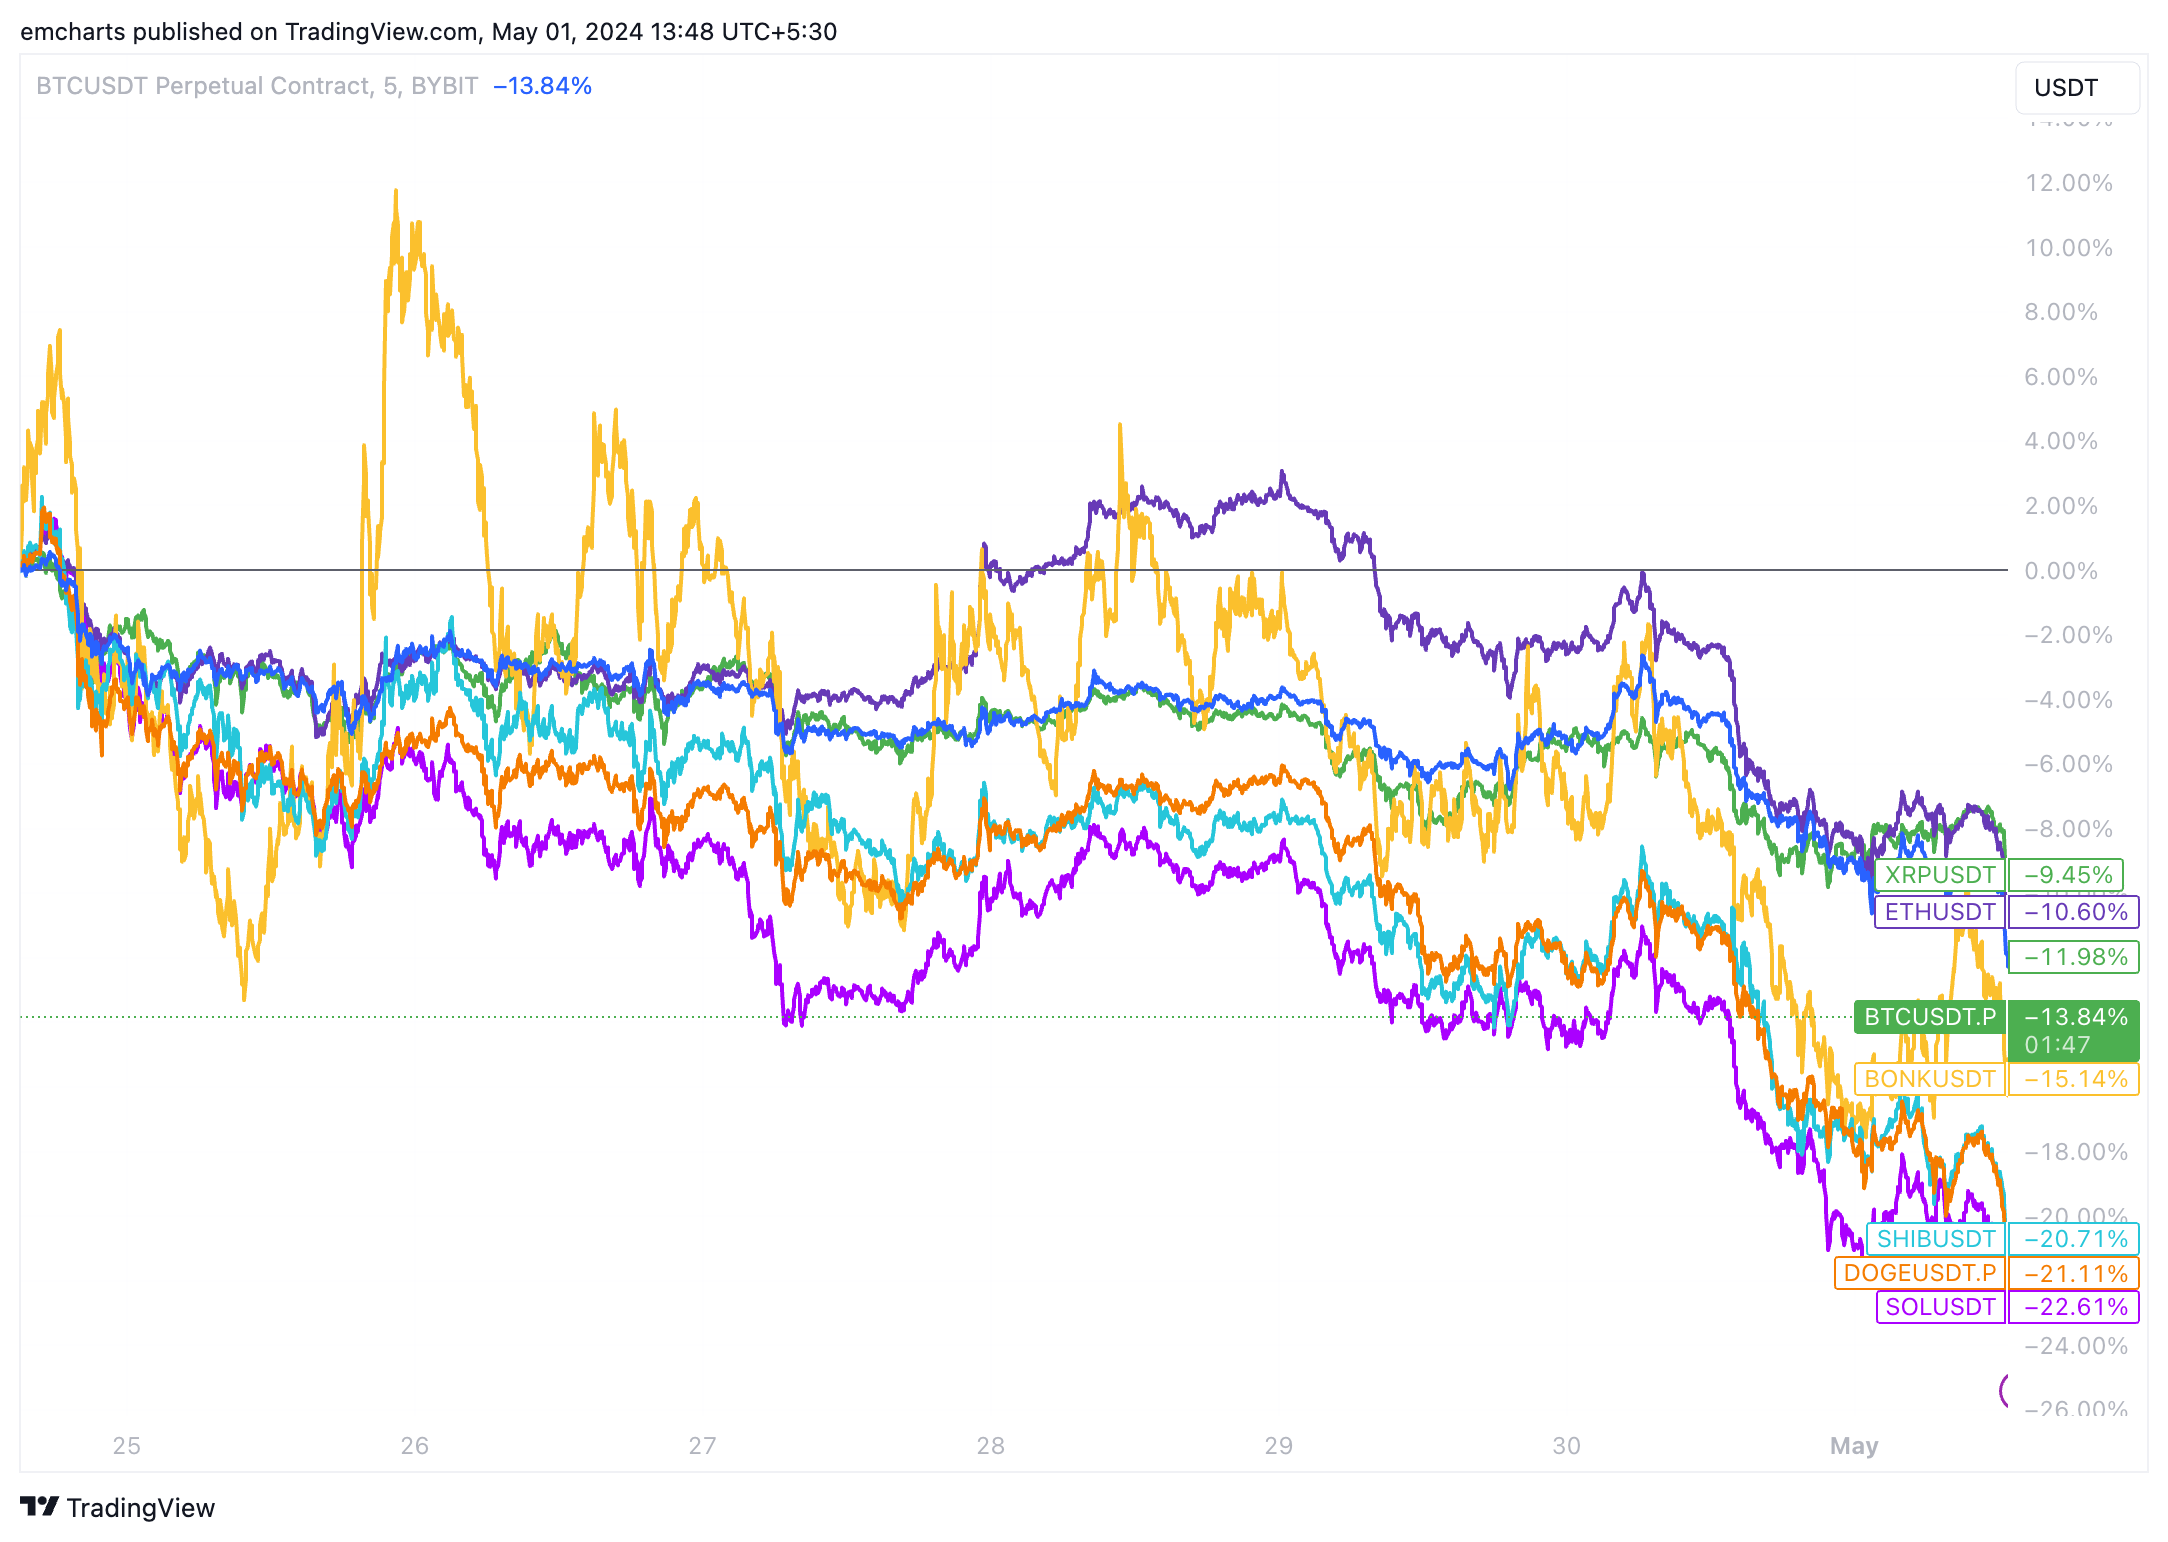
Price performance between April 24 and May 1
Dogecoin likely to revisit lows seen at the end of February
Dogecoin has been in a downward trend since March 28. The meme coin has formed consistently lower highs and lower lows. Nearly a month ago, on April 2, there was a bearish sign in Dogecoin’s Moving Average Convergence Divergence (MACD) indicator.
The signal line crossed over the MACD line, a bearish crossover that was followed by a further decline in DOGE price. In the ongoing correction, the February 29 and 28 lows of $0.1113 and $0.0947 are the next support levels. 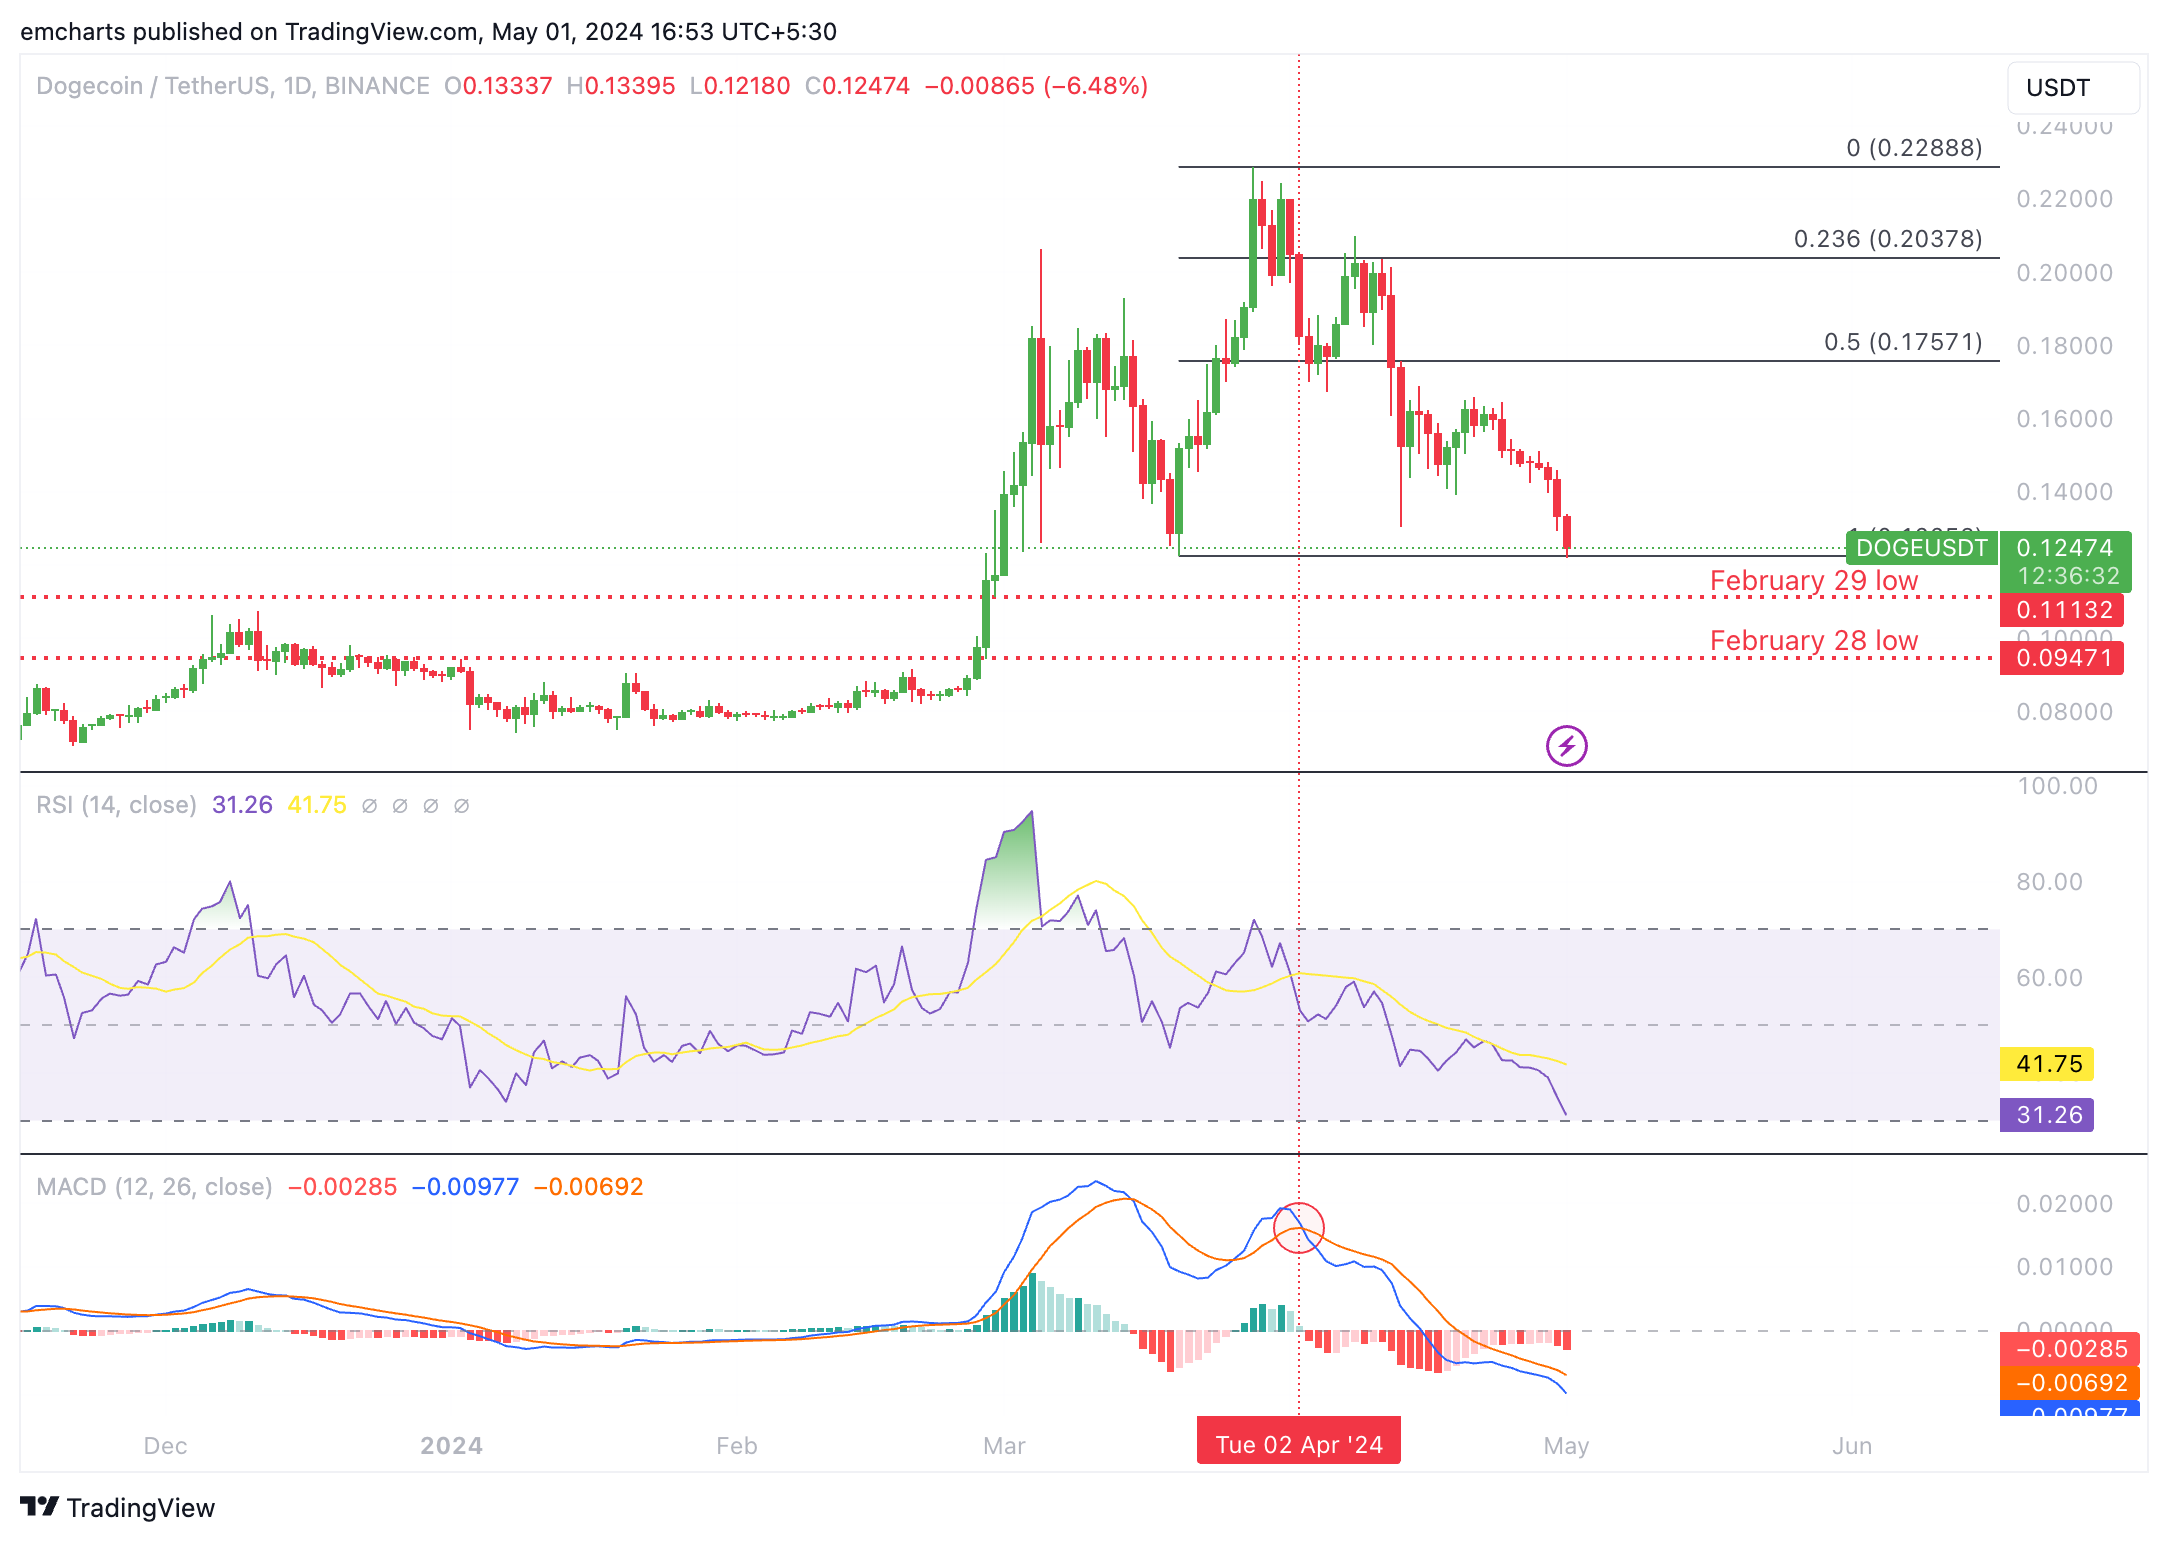
DOGE/USDT 1-day chart
A daily candlestick close above April 30 close at $0.1333 could invalidate the bearish thesis, indicating the possibility of a price recovery. In such a scenario, the April 30 high at $0.1460 is the immediate resistance for DOGE.
Shiba Inu holders brace for further correction
SHIB is gearing up for a 13% correction, or a decline to the April 13 low at $0.00001830, as its downward trend looks likely to persist.. The Relative Strength Index (RSI), a momentum oscillator, is at its lowest level since October 2023 at 34.66. Once RSI makes a comeback from its decline below 30, it could generate a buy signal, implying that SHIB is oversold.
The Moving Average Convergence/ Divergence (MACD) indicator crossed below the signal line on Monday. This reaffirms the bearish thesis for the Shiba-Inu-themed cryptocurrency.
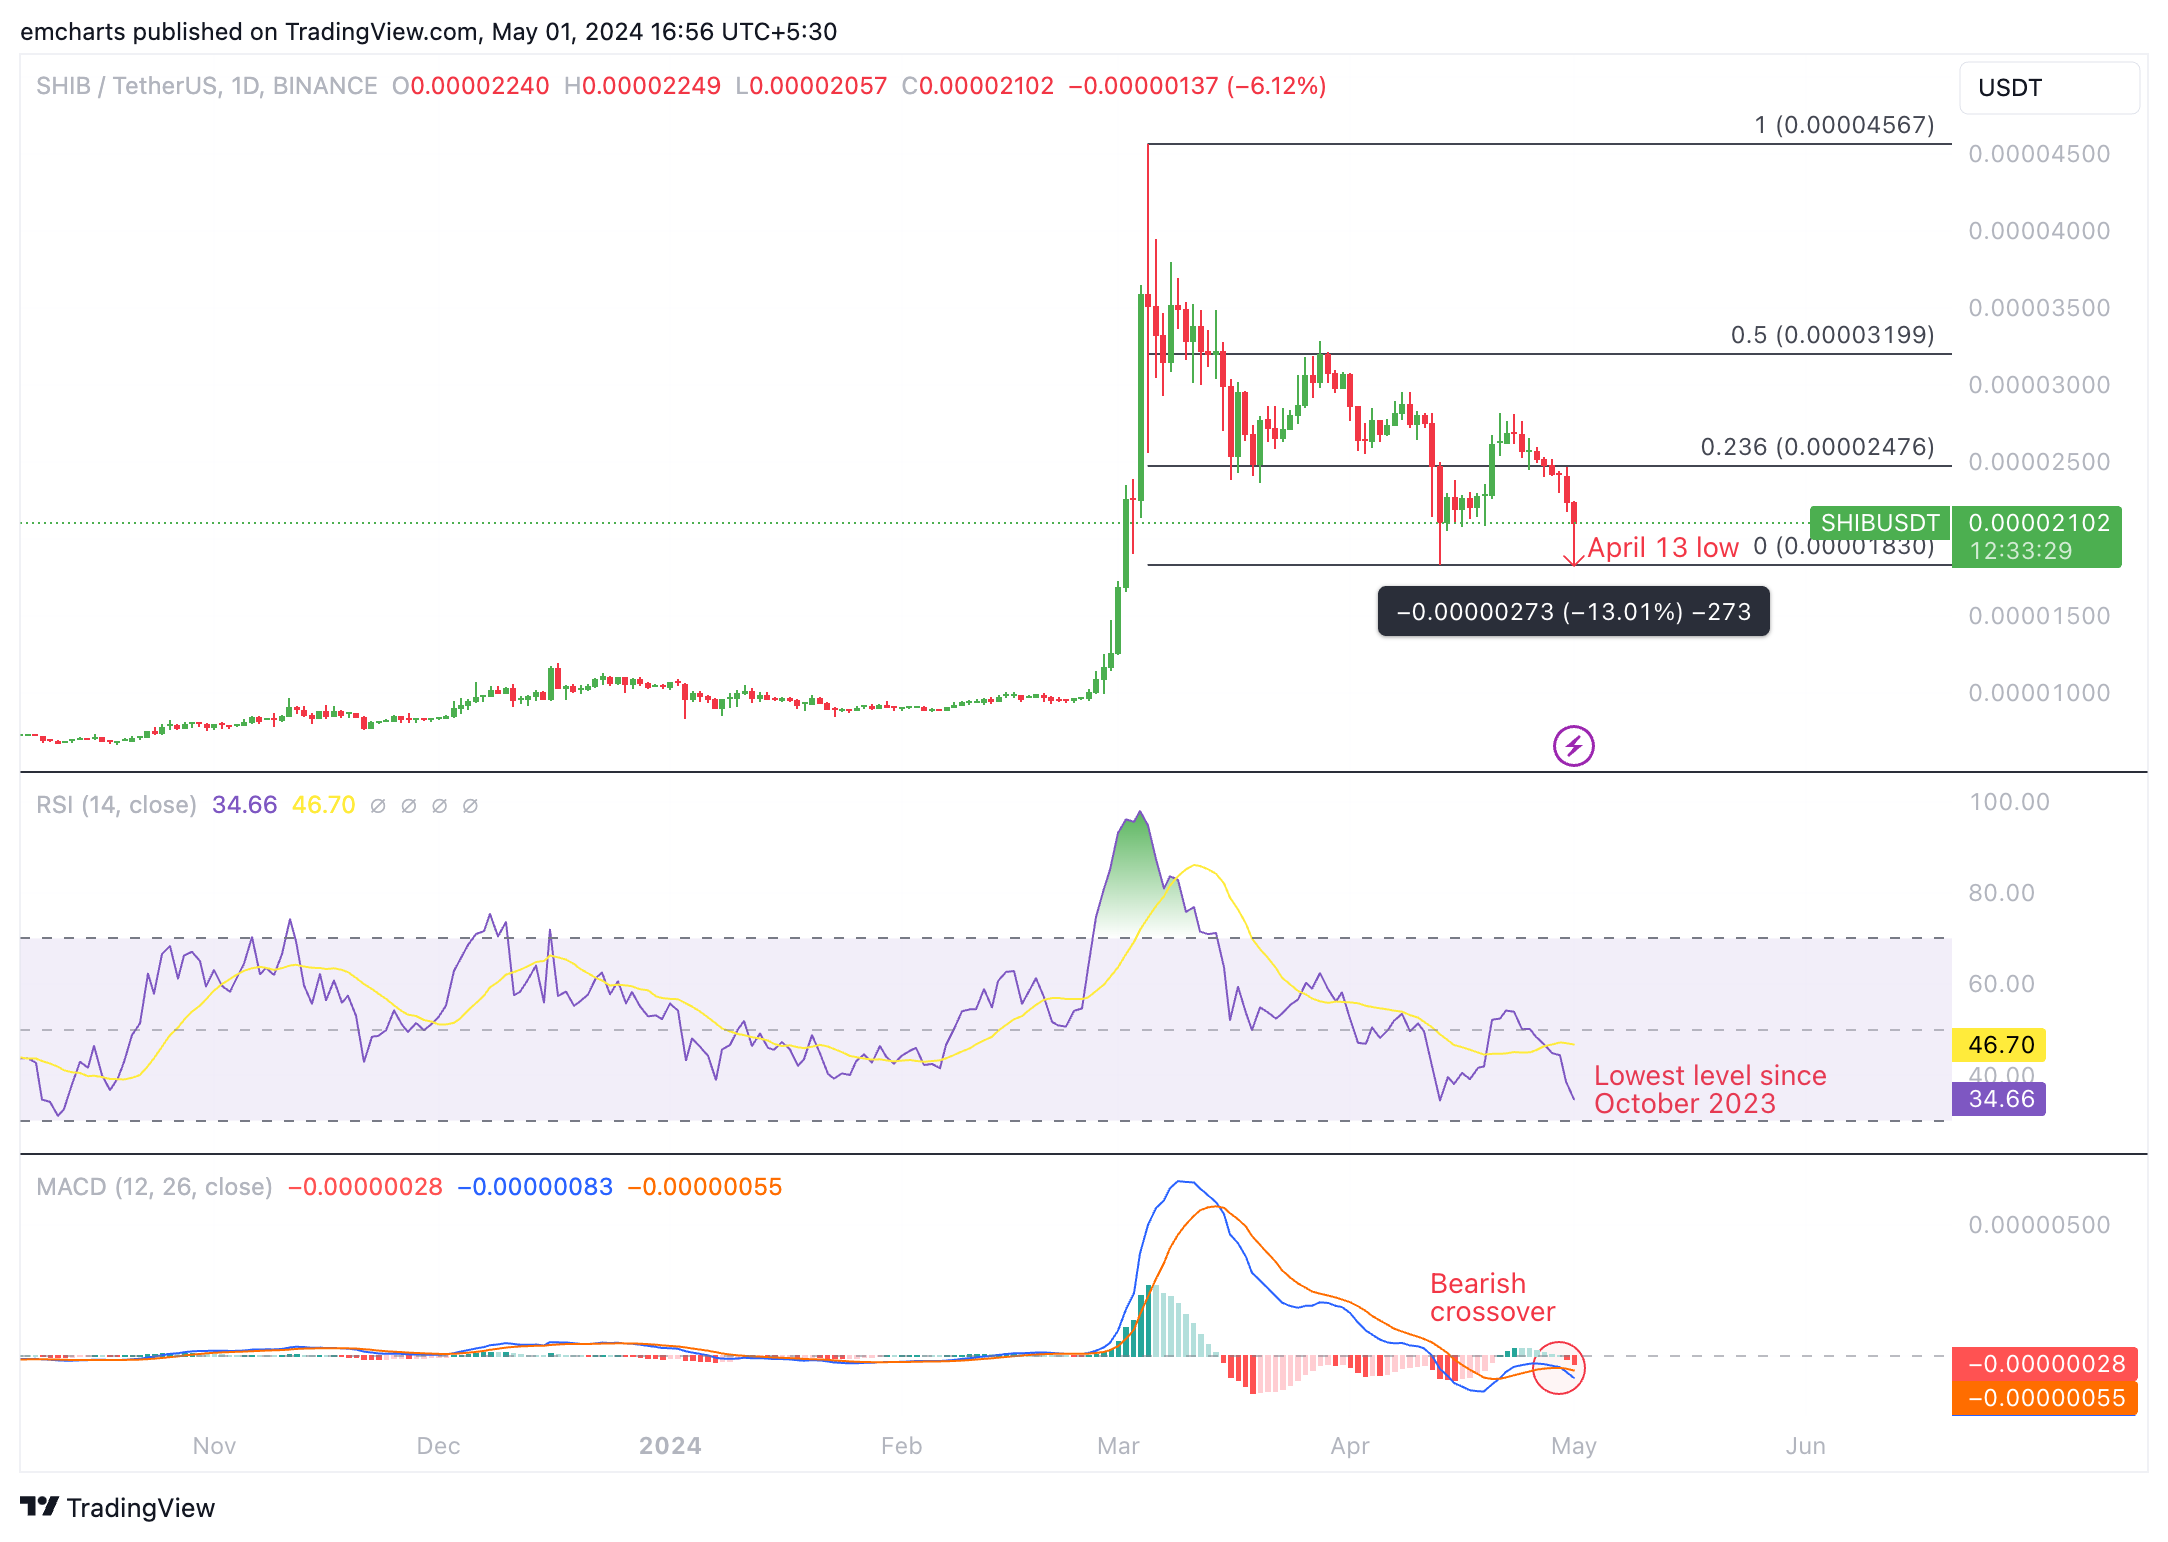
SHIB/USDT 1-day chart
If SHIB closes above $0.00002476 (the 23.6% Fibonacci retracement level of the decline between the March 5 top of $0.00004567 and the April 13 low of $0.00001830), it could invalidate the bearish thesis. SHIB faces immediate resistance at the April 23 high at $0.00002814.
Bonk likely to regain lost ground, bullish signs flash
Bonk is the only meme coin in the top three which is flashing signs of recovery. BONK broke out of its bearish trend on April 20, as signaled by the Moving Average Convergence/ Divergence (MACD) crossing above the signal line. This is typically considered a bullish sign.
The RSI has fallen to 47.79 at the time of writing, closer to 50 (neutral zone). BONK faces immediate resistance at $0.000026, the April 30 high.
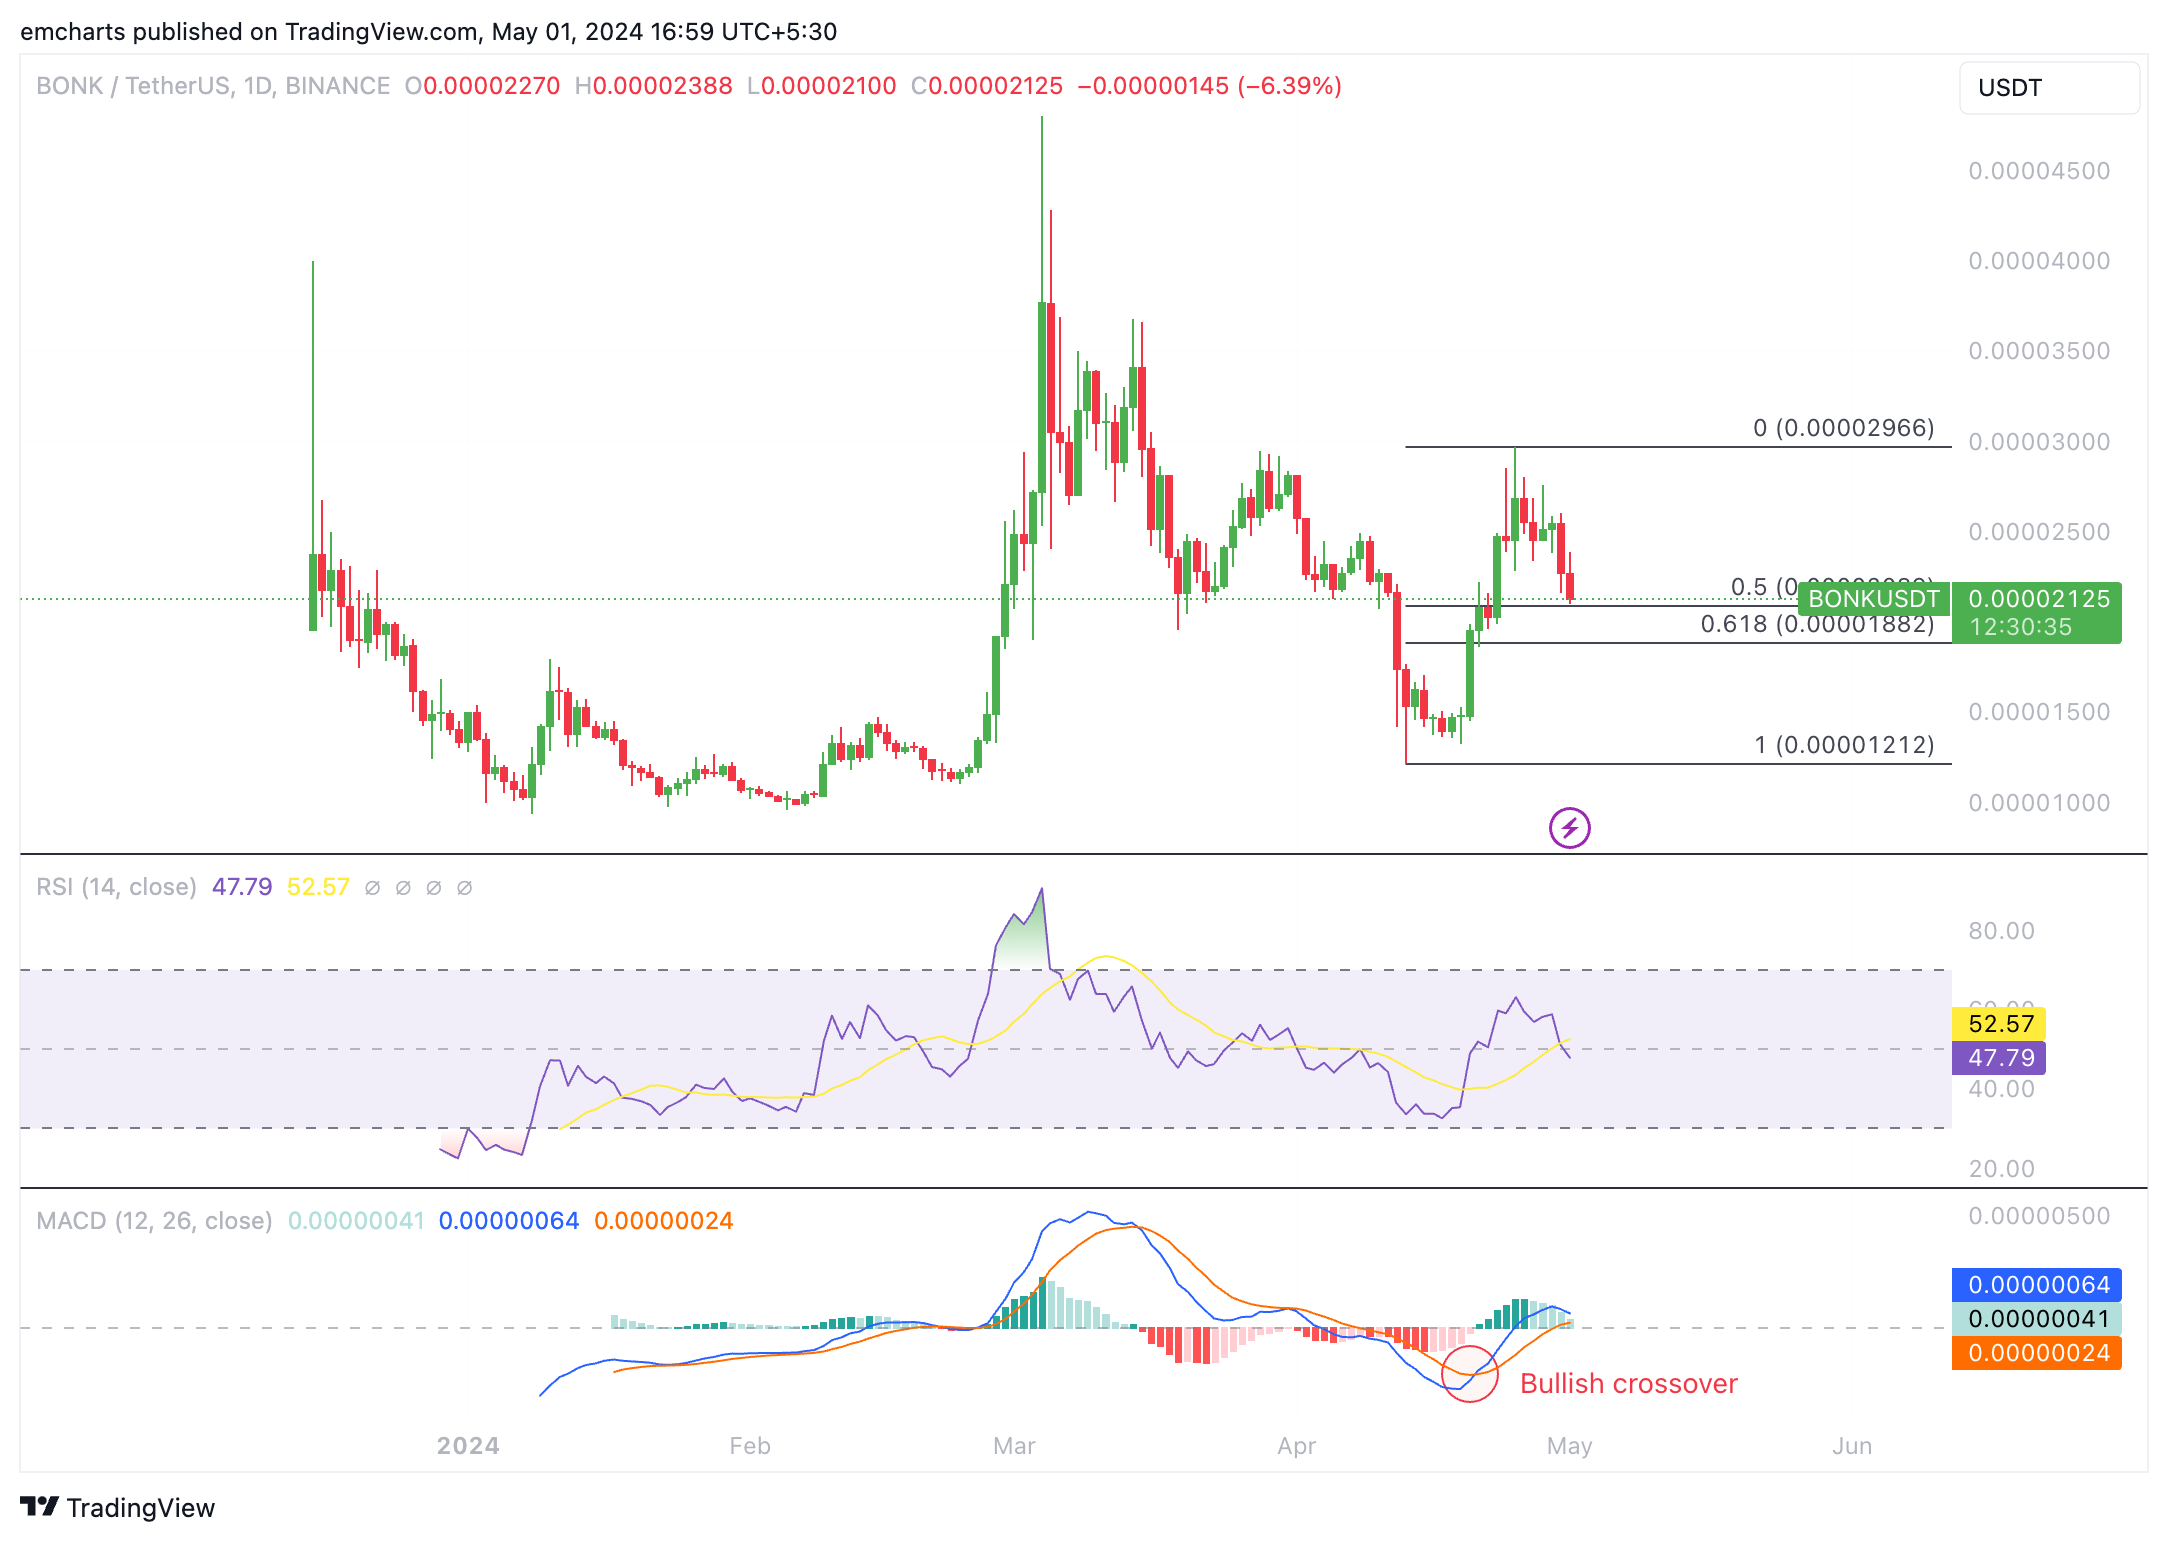
BONK/USDT 1-day chart
A daily candlestick close under the 50% Fibonacci retracement at $0.00002089 could invalidate the bullish thesis. Looking down, $0.00002089 and $0.00001882 are two support levels for BONK, coinciding with the 50% and 61.8% Fibonacci retracement levels of the climb from the April 13 low at $0.00001212 to the April 25 high at $0.00002966.