


- The daily chart reveals a subtle change in buyers’ momentum, noted by decreasing MACD green bars and a neutral RSI.
- Hourly indicators picture a balanced scenario for the session.
At the end of the week, the NZD/USD has lost 0.21% as buyers seem to have run out of steam. The sluggish trend momentum might suggest an emerging bearish grip, although the short-term positive outlook remains largely unbroken.
Despite the Relative Strength Index (RSI) sitting in the neutral zone and displaying a positive outlook, the overall trend appears to be flattening. The Moving Average Convergence Divergence (MACD) also echoes the slowing momentum, printing decreasing green bars.
NZD/USD daily chart

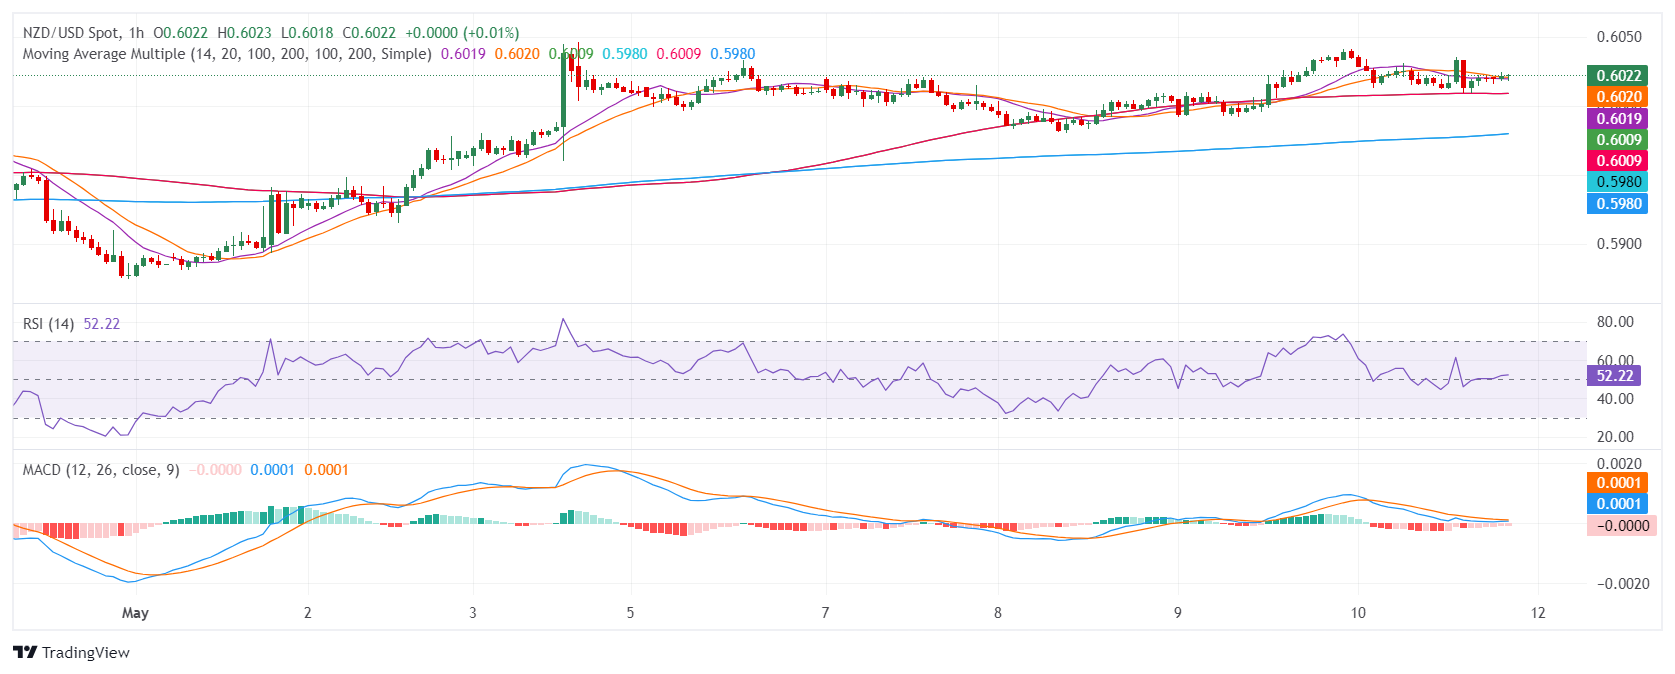
The hourly view shows a neutral bias with a mild lack of traction for either party reflected by the flat RSI and MACD.
NZD/USD hourly chart
A broader inspection highlights the NZD/USD residing beneath the crucial 100 and 200-day Simple Moving Averages (SMAs), lending credence to a bearish outlook. The alleged sellers’ strength is verified at the 200-day SMA barrier, further solidifying the short-term bearish slant as it rejected the buyers in Friday’s session. However, if the bulls manage to hold the key short-term 20-day SMA, the downside in the next sessions will be limited.