


- GBP/USD could test the immediate throwback support at the 1.2518 level and the nine-day EMA at 1.2514.
- The momentum indicator MACD could offer a clear bullish direction once it breaks above the centerline.
- The pair could test the upper boundary of the descending channel around 1.2570 level.
GBP/USD extends its gains for the third successive session on Friday, trading around 1.2550 during the Asian session. The pair consolidates within the descending channel on a daily chart, with the 14-day Relative Strength Index (RSI) moving above the 50-level. indicating the weakening of a bearish bias.
Additionally, the Moving Average Convergence Divergence (MACD) indicates a momentum shift as it is positioned above the signal line but below the centerline. This momentum indicator could confirm a clear direction for the GBP/USD pair once it breaks above the centerline.
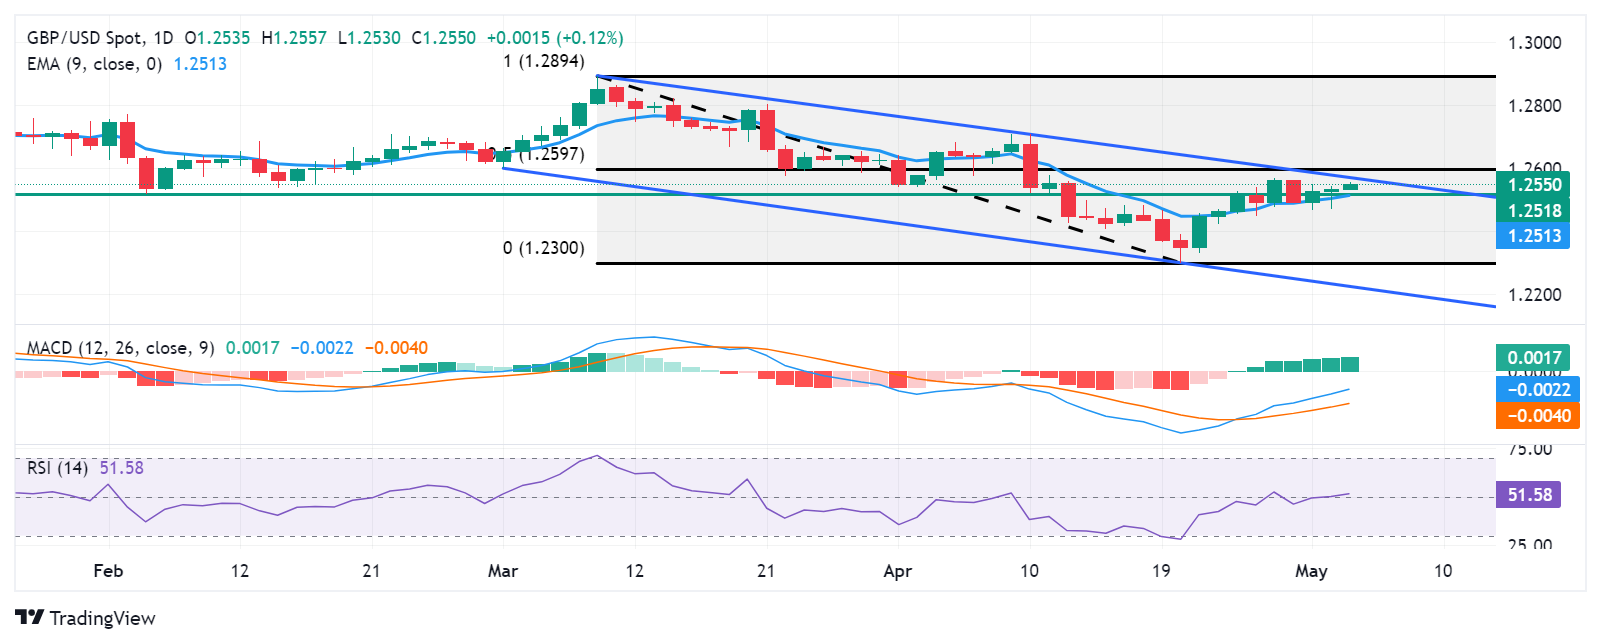
The GBP/USD pair could test the immediate throwback support at the 1.2518 level, aligned with the nine-day Exponential Moving Average (EMA) at 1.2514. The next support appears at the psychological level of 1.2500. A break below this level could exert pressure on the pair to navigate the region around the six-month low of 1.2300.
On the upside, the immediate resistance appears at the upper boundary of the descending channel around the level of 1.2570 followed by the 50% retracement level at 1.2597 level, plotting between the range of 1.2894 and 1.2300.
GBP/USD: Daily Chart