- The New Zealand Dollar weakens in its most traded pairs after weak consumer confidence data.
- The New Zealand economy suffers from the twin evils of high inflation and weak growth, further weighing on NZD.
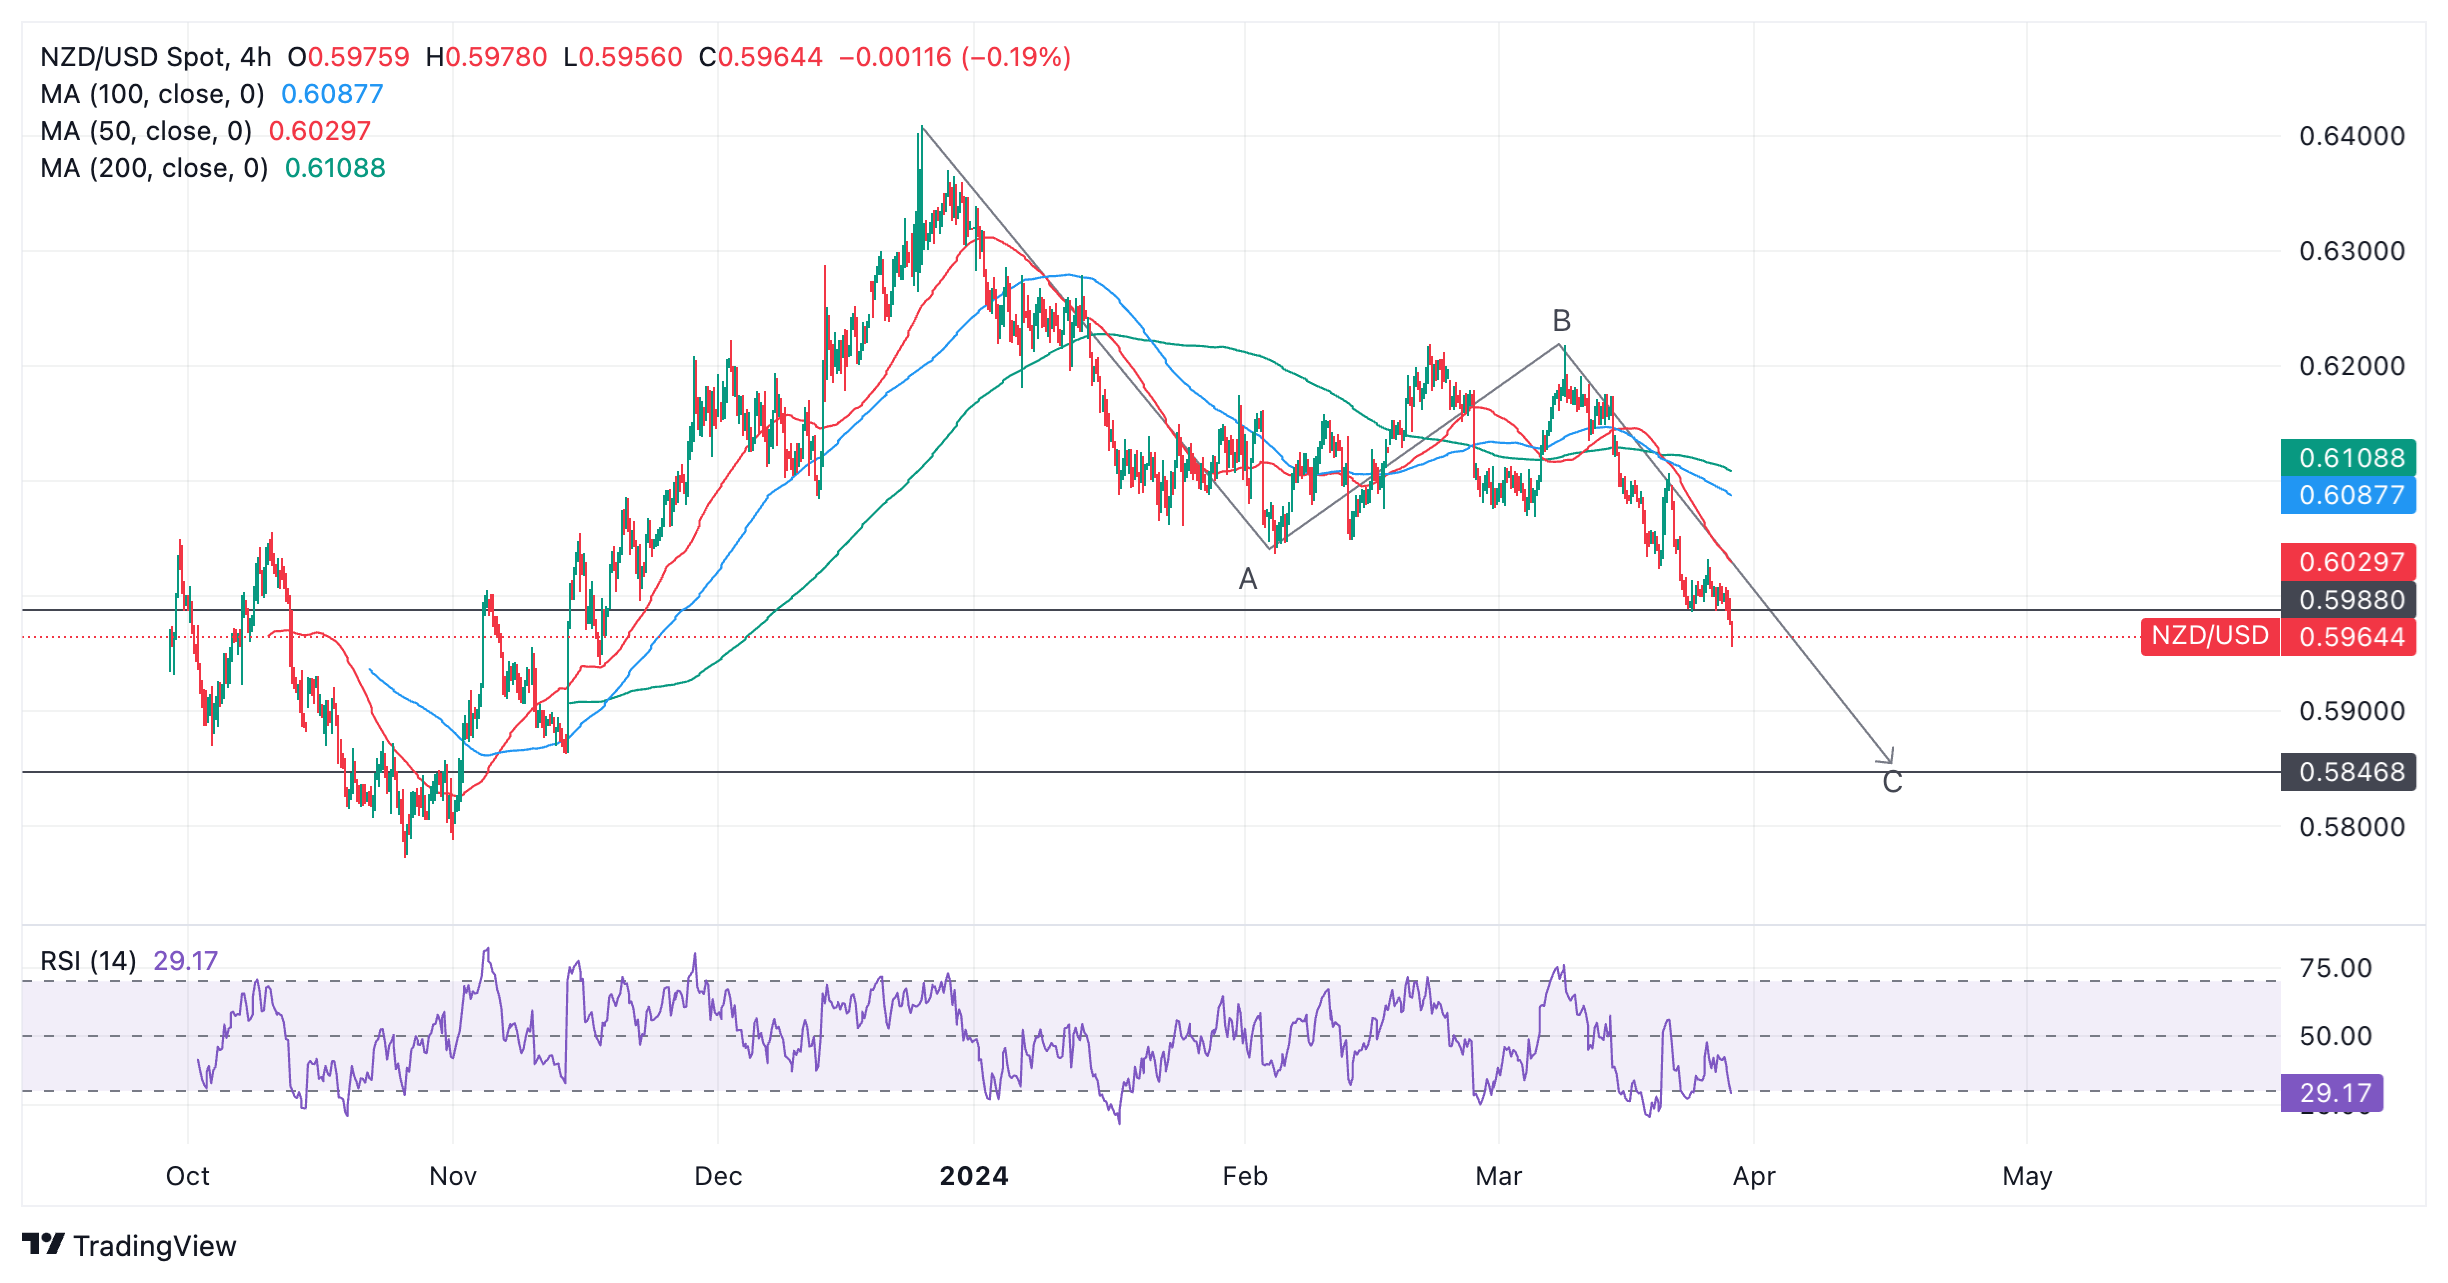
- The NZD/USD chart is showing a bearish pattern underway with new lows probably on the radar.
The New Zealand Dollar (NZD) is weakening across the board on Thursday, after a leading indicator of consumer confidence in New Zealand deteriorated sharply in February.
The currency is further hampered by an economy that is suffering from the twin evils of high inflation and low growth, leaving the central bank with little room for maneuver.
New Zealand Dollar undermined by a weak Roy Morgan
The New Zealand Dollar has depreciated after a sharp fall in the Roy Morgan Consumer Confidence indicator, a leading index that measures the “level of consumer confidence in economic activity.”
The data released overnight showed the index falling to 86.4 in February from 94.5 in January, the lowest level since July 2023, according to ANZ bank.
-638472241243721101.png)
Roy Morgan Consumer Confidence: Monthly
New Zealand fell into a technical recession in Q4 of 2023, following two quarters of negative economic growth.
Inflation, as measured by the Consumer Price Index, remains relatively high at 4.7% in Q4 after falling from 5.6% in Q3. The largest contributor was Housing and Housing Utilities, which showed a 4.8% rise and accounts for the largest share of the basket.
The poor economic data suggests the Reserve Bank of New Zealand (RBNZ) is trapped: it must keep interest rates high at 5.5% in order to bring down inflation but would probably prefer to reduce interest rates to stimulate growth. This is probably a further factor weighing on the NZD.
The structural problem of a tight labor market due to insufficient workers limits growth and keeps wages relatively high.
Technical Analysis: New Zealand Dollar in bearish pattern against USD
NZD/USD price, which measures the buying power of one New Zealand Dollar in US Dollar (USD) terms, is falling in a bearish three-wave pattern, known as a Measured Move.
The pattern consists of three waves, usually labeled ABC, in which wave A and C are usually of the same length.

New Zealand Dollar versus US Dollar: 4-hour chart
Assuming the pattern unfolds as expected, the pair is likely to continue its decline until it reaches the target for the end of wave C, located at 0.5847.
NZD/USD has already broken below the conservative target for the pattern at 0.5988, measured as wave C ending at the 0.618 Fibonacci ratio of the length of wave A.
The pair is in a short-term downtrend which, according to the adage that “the trend is your friend,” is likely to continue.
The Relative Strength Index (RSI) momentum indicator is converging slightly with price, which is a mildly bullish significator. Convergence occurs when price falls to lower lows but RSI fails to reflect this. In the case of NZD/USD, the RSI is not as low as it was on March 19 even though the price is.
This could indicate the possibility of an upside correction occurring, although the dominant downtrend would still be expected to resume once the correction was complete.
New Zealand Dollar FAQs
The New Zealand Dollar (NZD), also known as the Kiwi, is a well-known traded currency among investors. Its value is broadly determined by the health of the New Zealand economy and the country’s central bank policy. Still, there are some unique particularities that also can make NZD move. The performance of the Chinese economy tends to move the Kiwi because China is New Zealand’s biggest trading partner. Bad news for the Chinese economy likely means less New Zealand exports to the country, hitting the economy and thus its currency. Another factor moving NZD is dairy prices as the dairy industry is New Zealand’s main export. High dairy prices boost export income, contributing positively to the economy and thus to the NZD.
The Reserve Bank of New Zealand (RBNZ) aims to achieve and maintain an inflation rate between 1% and 3% over the medium term, with a focus to keep it near the 2% mid-point. To this end, the bank sets an appropriate level of interest rates. When inflation is too high, the RBNZ will increase interest rates to cool the economy, but the move will also make bond yields higher, increasing investors’ appeal to invest in the country and thus boosting NZD. On the contrary, lower interest rates tend to weaken NZD. The so-called rate differential, or how rates in New Zealand are or are expected to be compared to the ones set by the US Federal Reserve, can also play a key role in moving the NZD/USD pair.
Macroeconomic data releases in New Zealand are key to assess the state of the economy and can impact the New Zealand Dollar’s (NZD) valuation. A strong economy, based on high economic growth, low unemployment and high confidence is good for NZD. High economic growth attracts foreign investment and may encourage the Reserve Bank of New Zealand to increase interest rates, if this economic strength comes together with elevated inflation. Conversely, if economic data is weak, NZD is likely to depreciate.
The New Zealand Dollar (NZD) tends to strengthen during risk-on periods, or when investors perceive that broader market risks are low and are optimistic about growth. This tends to lead to a more favorable outlook for commodities and so-called ‘commodity currencies’ such as the Kiwi. Conversely, NZD tends to weaken at times of market turbulence or economic uncertainty as investors tend to sell higher-risk assets and flee to the more-stable safe havens.


