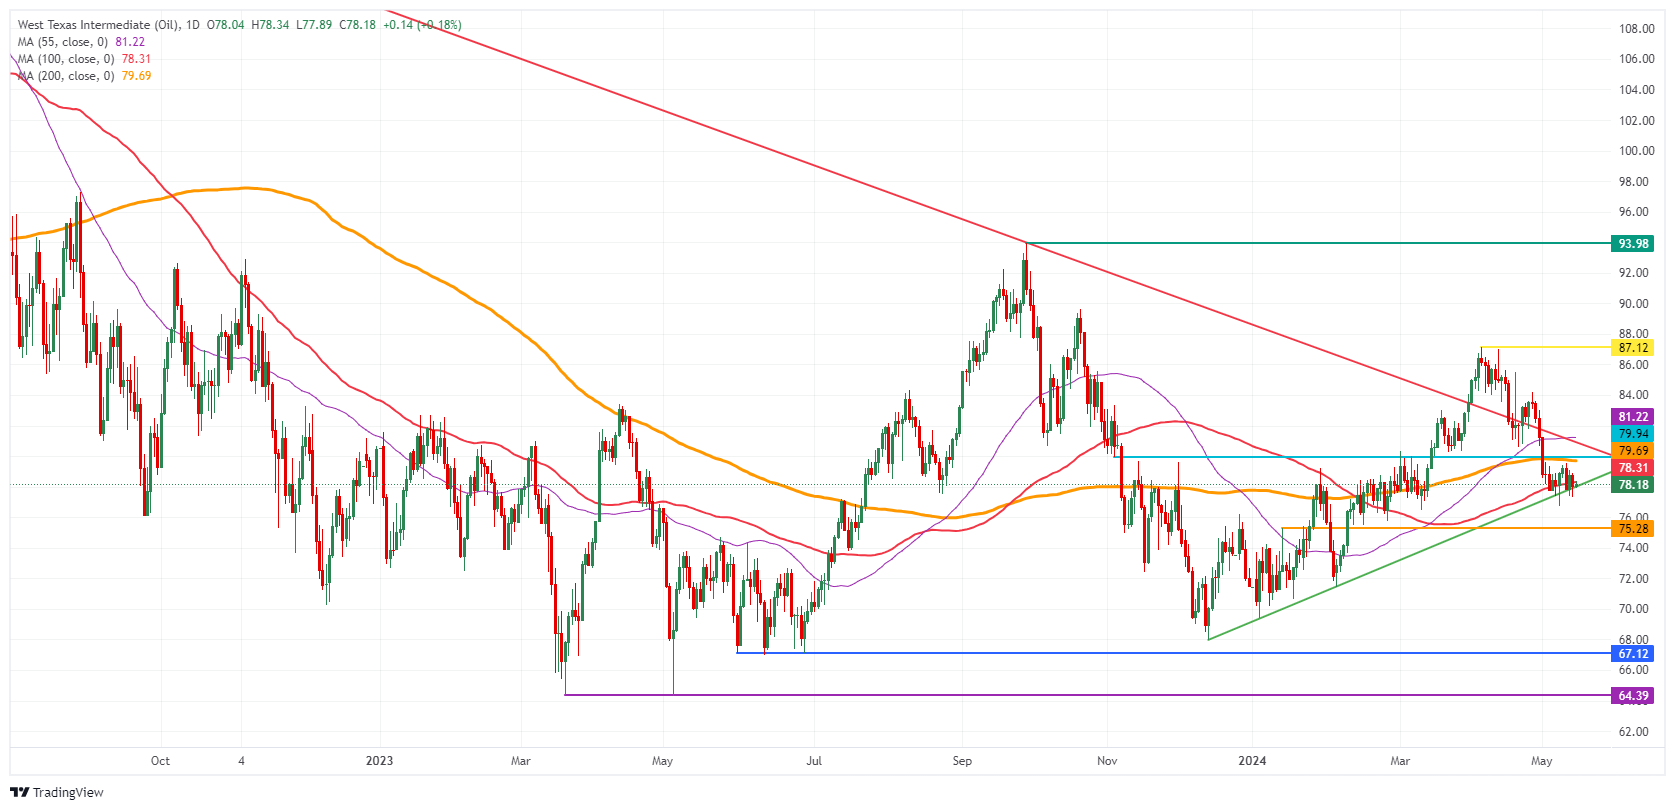
- Oil trades below $78.00 after both OPEC and IEA released their monthly reports.
- While OPEC stuck to previous expectations, sluggish demand is forecasted in the IEA release.
- The US Dollar Index eases ahead of the US CPI print.
Oil prices are sliding below $78 on Wednesday, after increased downward pressure got too big when factoring in all elements that are on the table at the moment. Besides the fragile equilibrium in the Middle East and the Red Sea, the recent OPEC and International Energy Administration (IEA) reports aren’t portraying a clear picture either, with the IEA slashing its forecast for Oil demand and OPEC sticking to its previous expectations. As if the outlook picture is not blurred enough, the steady-for-longer stance from the US Federal Reserve (Fed) is postponing that initial rate cut, which would mean a surge in demand.
Meanwhile, the US Dollar Index (DXY) is retreating further below 105.00 after the US Consumer Price Index (CPI) print. Markets were convinced the number would be lower than previously anticipated after the Producer Price Index (PPI) release on Tuesday saw downward revision across the board in both core and headline PPI. With CPI back in its disinflationary path, more Dollar selling could be taking place in the coming days.
At the time of writing, Crude Oil (WTI) trades at $77.22 and Brent Crude at $81.61.
Oil news and market movers: Off the low for now
- Ahead of the next OPEC meeting, the group has ordered an outside, external review to know how much capacity each member has, Bloomberg reports.
- Mexico has lowered its pricing for Maya Oil for Gulf Coast refiners, Reuters reports.
- The IEA reports that World consumption will increase by 1.1 million barrels per day this year, which is 140k barrels less than expected a month ago.
- At 14:30 GMT the Energy Information Administration has released the weekly US Crude stock pile changes. Previous was a drawdown of 1.362 million barrels with a chunky 2.508 million barrels drawdown outpacing the expected 1.35million barrels.
Oil Technical Analysis: EIA drawdown print delivers small bounce
Oil prices are set to crack under pressure with the steady-for-longer rate stance of the Federal Reserve. Fed Chairman Jerome Powell confirmed this stance again on Tuesday during a speech in Amsterdam. This means that the surge in demand from the US will not take place until after the summer at earliest, so Crude isn’t likely to break above substantial pivotal levels as long as demand is not outpacing supply.
On the upside, the line in the sand remains at $79.73 with the 200-day Simple Moving Average (SMA). Once above that level, a double layer comes up with the 100-day SMA at $78.23. In case of an upward extension above that zone, the road is open for $87.12 again.
On the downside, the pivotal level at $75.28 is the last solid line in the sand that could end this decline. If this level is unable to hold, investors could expect an accelerated sell-off towards $72.00 and $70.00. That would erase all gains for 2024 and then Oil price could test $68, the December 13 low.

US WTI Crude Oil: Daily Chart
WTI Oil FAQs
WTI Oil is a type of Crude Oil sold on international markets. The WTI stands for West Texas Intermediate, one of three major types including Brent and Dubai Crude. WTI is also referred to as “light” and “sweet” because of its relatively low gravity and sulfur content respectively. It is considered a high quality Oil that is easily refined. It is sourced in the United States and distributed via the Cushing hub, which is considered “The Pipeline Crossroads of the World”. It is a benchmark for the Oil market and WTI price is frequently quoted in the media.
Like all assets, supply and demand are the key drivers of WTI Oil price. As such, global growth can be a driver of increased demand and vice versa for weak global growth. Political instability, wars, and sanctions can disrupt supply and impact prices. The decisions of OPEC, a group of major Oil-producing countries, is another key driver of price. The value of the US Dollar influences the price of WTI Crude Oil, since Oil is predominantly traded in US Dollars, thus a weaker US Dollar can make Oil more affordable and vice versa.
The weekly Oil inventory reports published by the American Petroleum Institute (API) and the Energy Information Agency (EIA) impact the price of WTI Oil. Changes in inventories reflect fluctuating supply and demand. If the data shows a drop in inventories it can indicate increased demand, pushing up Oil price. Higher inventories can reflect increased supply, pushing down prices. API’s report is published every Tuesday and EIA’s the day after. Their results are usually similar, falling within 1% of each other 75% of the time. The EIA data is considered more reliable, since it is a government agency.
OPEC (Organization of the Petroleum Exporting Countries) is a group of 13 Oil-producing nations who collectively decide production quotas for member countries at twice-yearly meetings. Their decisions often impact WTI Oil prices. When OPEC decides to lower quotas, it can tighten supply, pushing up Oil prices. When OPEC increases production, it has the opposite effect. OPEC+ refers to an expanded group that includes ten extra non-OPEC members, the most notable of which is Russia.


