


- COTI price action is about to break out after forming a bullish double-bottom formation.
- On-chain data shows a positive trend as COTI’s open interest and daily active addresses are rising.
- A daily candlestick close below $0.082 would invalidate the bullish thesis.
COTI (COTI), the native token from the privacy-centric layer on the Ethereum network, is approaching the breakout level of the double-bottom technical pattern formation on Friday. This pattern breakout signals a reversal favoring bulls, with the possibility of a 30% rally from the current price levels. This bullish projection is further supported by COTI’s rising open interest and daily active addresses.
COTI looks set to extend recent rally
COTI price rose and closed at $0.102 in mid-August after bouncing off from $0.073. From early August to early September, it formed a W-like structure known as a double-bottom technical pattern, which often signals a potential trend reversal favoring the bulls. At the time of writing on Friday, it is nearing the breakout level of $0.101, also known as the neckline.
If COTI breaks decisively and closes above the $0.101 level, it could rally 29% to restest its July 27 high of $0.132. This level also broadly aligns with the height of the double-bottom pattern extrapolated higher.
The Moving Average Convergence Divergence (MACD) indicator, which shows a bullish crossover on the daily chart, further supports this bullish outlook. Its MACD line (blue line) trades above the signal line (yellow line), suggesting that the bulls are buying. Additionally, it shows rising green histogram bars above its neutral line zero, indicating bullish momentum.
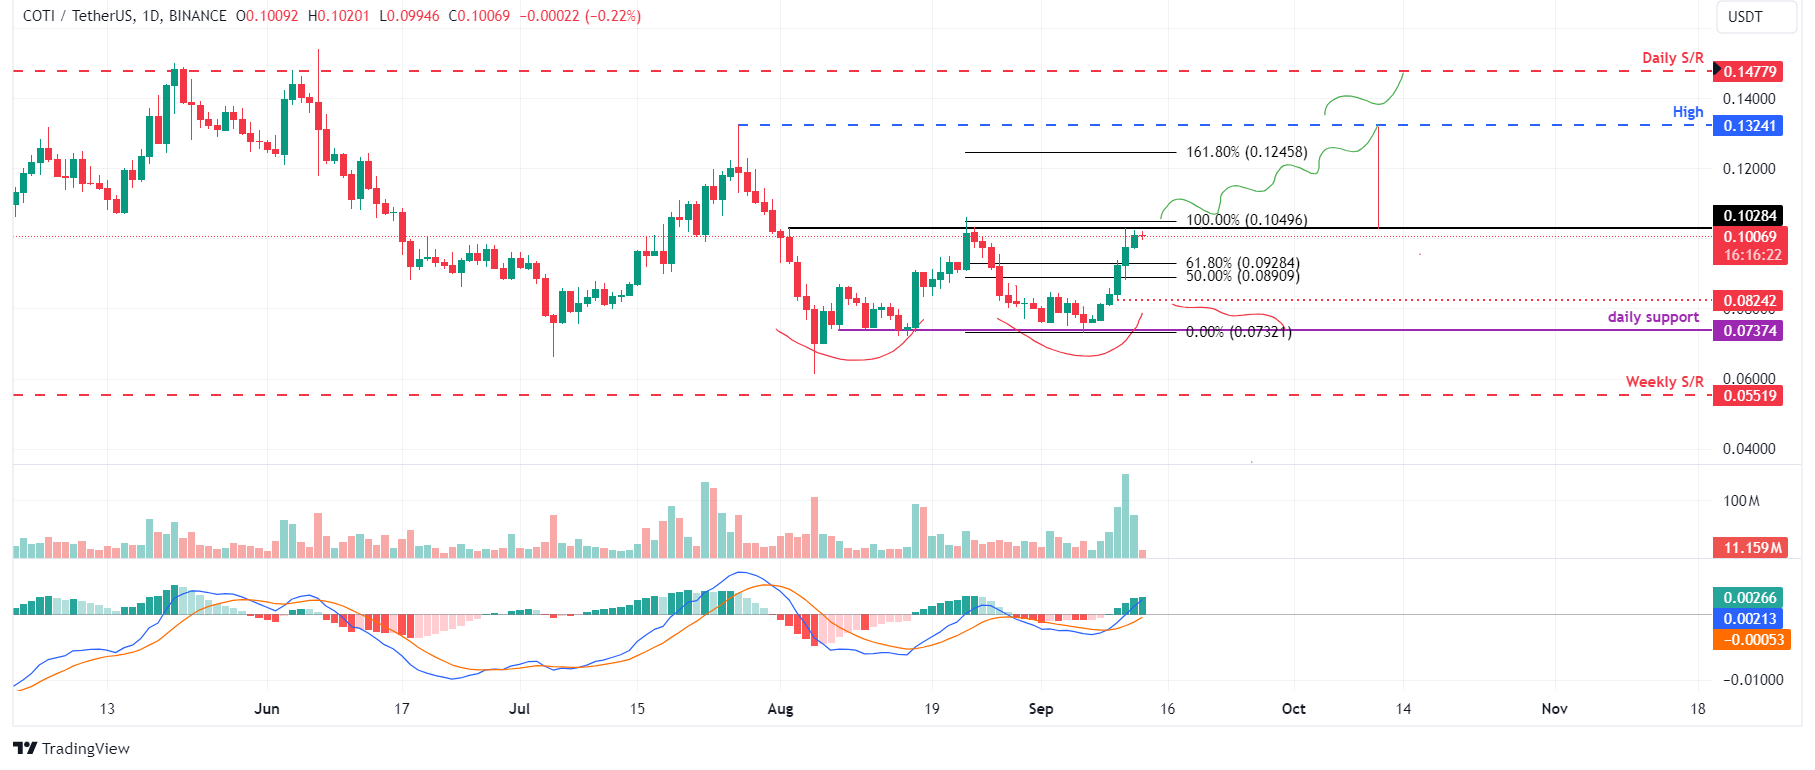
COTI/USDT daily chart
The on-chain data further supports the bullish outlook. Data from CoinGlass futures shows that Open Interest (OI) in COTI at exchanges is rising. The OI indicates the total number of outstanding derivative contracts that have not been settled (offset by delivery) and whether money flows into the contract are increasing or decreasing.
Increasing OI represents new or additional money entering the market and new buying, which suggests a bullish trend. When OI decreases, it is usually a sign that the market is liquidating, more investors are leaving, and the current price trend is ending.
The graph below shows that COTI’s OI increased from $10.31 million on Tuesday to $17.54 on Thursday, reaching the highest level since July 28. This indicates that new buying is occurring.
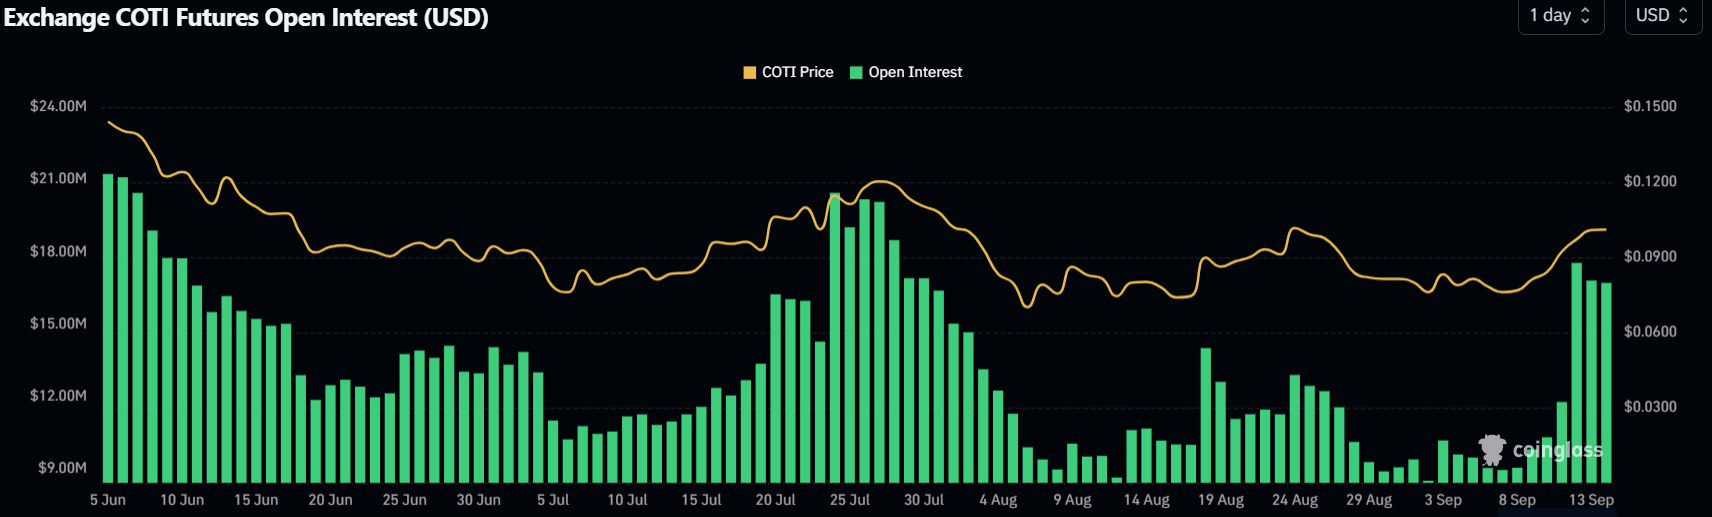
COTI Open Interest chart
Santiment’s Daily Active Addresses metric, which tracks network activity over time, is positive too. A rise in the index signals greater blockchain usage while declining addresses point to lower demand for the network.
In COTI’s case, the index rose 23% from Monday to Wednesday and is at the highest since July 24, indicating that demand for COTI’s blockchain usage is increasing.
%20%5B10.51.48,%2013%20Sep,%202024%5D-638618103496867483.png)
COTI Daily Active Addresses chart
Despite the bullish outlook projected by the technical analysis and on-chain data, the outlook would turn bearish if COTI’s daily candlestick fails to break above the $0.102 level and closes below the September 10 low of $0.082. This development would lead to an 11% crash in COTI’s price to restest its daily support level at $0.073.