- XRP price retreats over 3% amid a market-wide correction led by Bitcoin.
- The drop in the derivatives market’s Open Interest to $3.84 billion signals waning confidence in XRP’s uptrend
- In the last 24 hours, long position liquidations have exceeded $10 million, compared to almost $3 million in short positions.
Ripple (XRP) price is reversing gains at the time of writing on Thursday, following a widespread recovery in the cryptocurrency market on Wednesday. XRP rallied behind Bitcoin (BTC) and reached a previous day’s high of $2.30 as global markets digested United States (US) President Donald Trump’s softened tone regarding Federal Reserve (Fed) Chair Jerome Powell and China.
President Trump urged Jerome to be proactive and cut interest rates. The US is optimistic that it will soon resolve the trade and tariff standoff with China, hinting at the potential easing of tariffs ahead of a comprehensive agreement in two years.
XRP price retests short-term support as liquidations surge
XRP price hovers at $2.14 at the time of writing, reflecting bearish sentiment in the wider cryptocurrency market. According to derivatives market data from Coinglass, the XRP Open Interest (OI) has decreased by 2.67% to $3.84 billion over the last 24 hours. This drawback in the price of XRP triggered liquidations on the last day, where long positions valued at $10.05 million were forcibly closed, compared to approximately $3 million in short positions.
The drop in XRP’s derivatives OI reflects a significant decline in trader confidence, which could lead to reduced market participation. In addition to the liquidation of long positions, this mirrors heightened selling pressure, as bullish traders are forcefully ejected from the market.
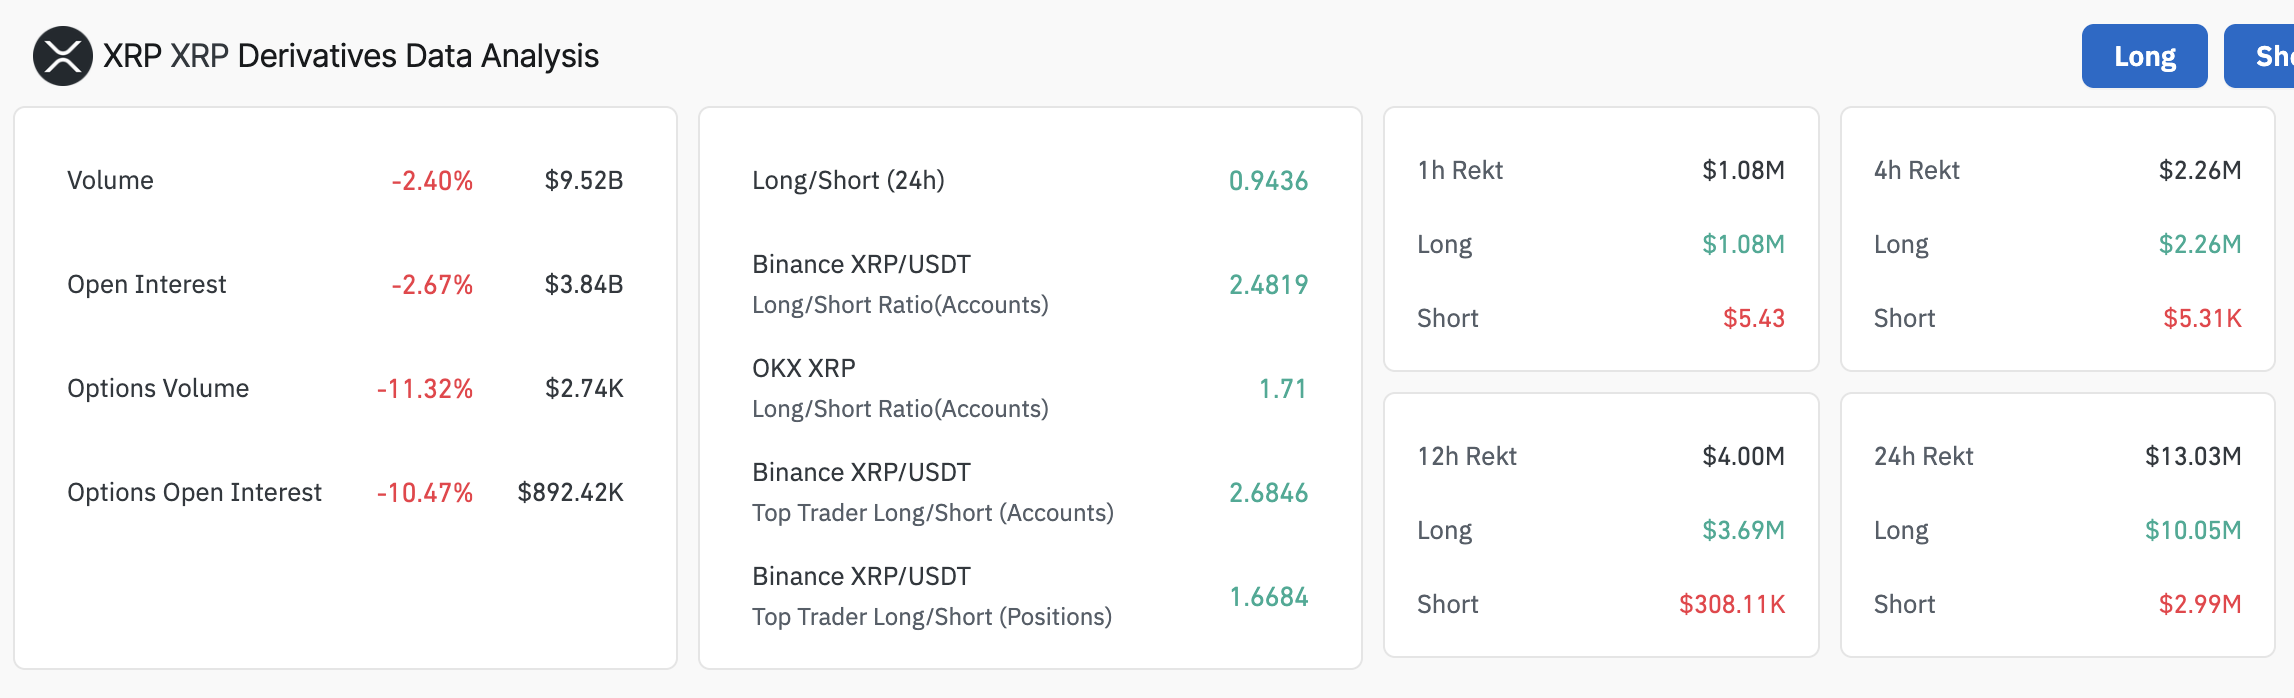
XRP derivatives data | Source: Coinglass
The 24-hour long/short ratio of 0.9436, combined with a 2.4% drop in trading volume to $9.52 billion, suggests waning market activity. XRP price could face increased downward pressure, potentially breaking below key support areas and accelerating its decline in the near term.
Is the XRP price pullback temporary?
XRP price hovers near the 100 Exponential Moving Average (EMA) at $2.14 after testing the immediate support at $2.11 provided by the 50 EMA on the 8-hour chart below. This follows a reversal from Wednesday’s high of $2.30.
The Relative Strength Index (RSI) indicator’s position at 52.42, as it approaches the midline, reinforces the bearish sentiment. Beyond the 50 EMA support, the next critical level for XRP is $2.00, a significant anchor since March. April’s low, approximately $1.62, is another level to keep in mind in the coming days and weeks.
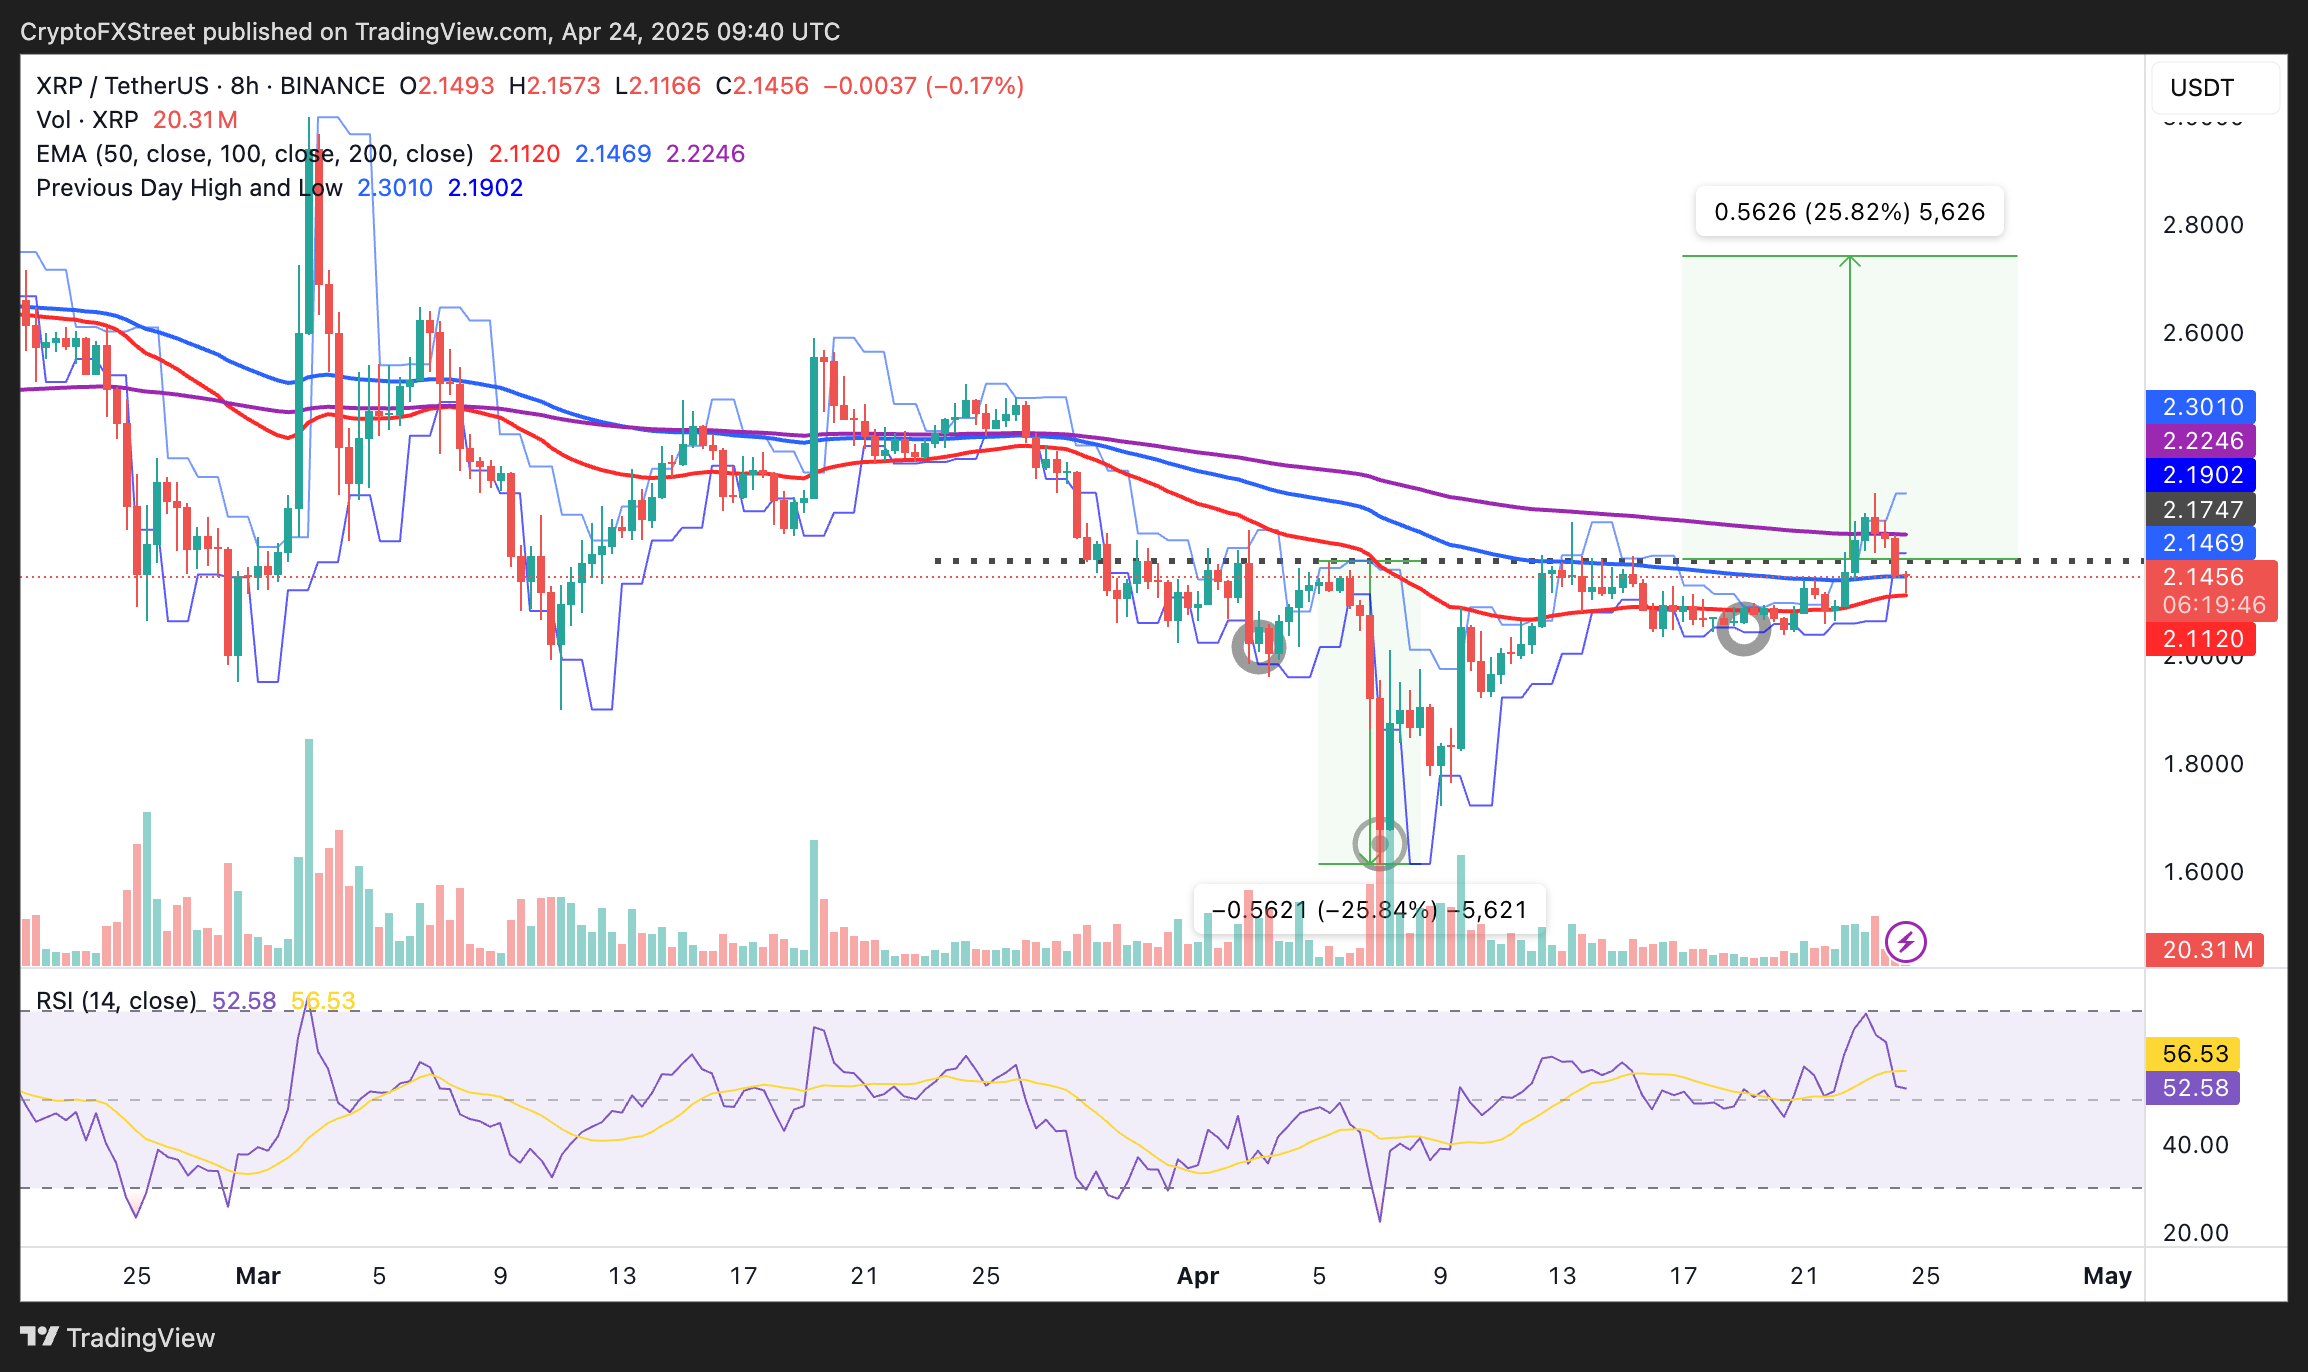
XRP/USD 8-hour chart
If XRP price navigates the current challenges and reverses the trend upwards, an inverse head and shoulders pattern highlighted on the chart above could return in focus, projecting a 26% increase to $2.74. This target is determined by measuring the distance between the dotted line and the lowest point of the pattern’s head and then extrapolating above the breakout point.