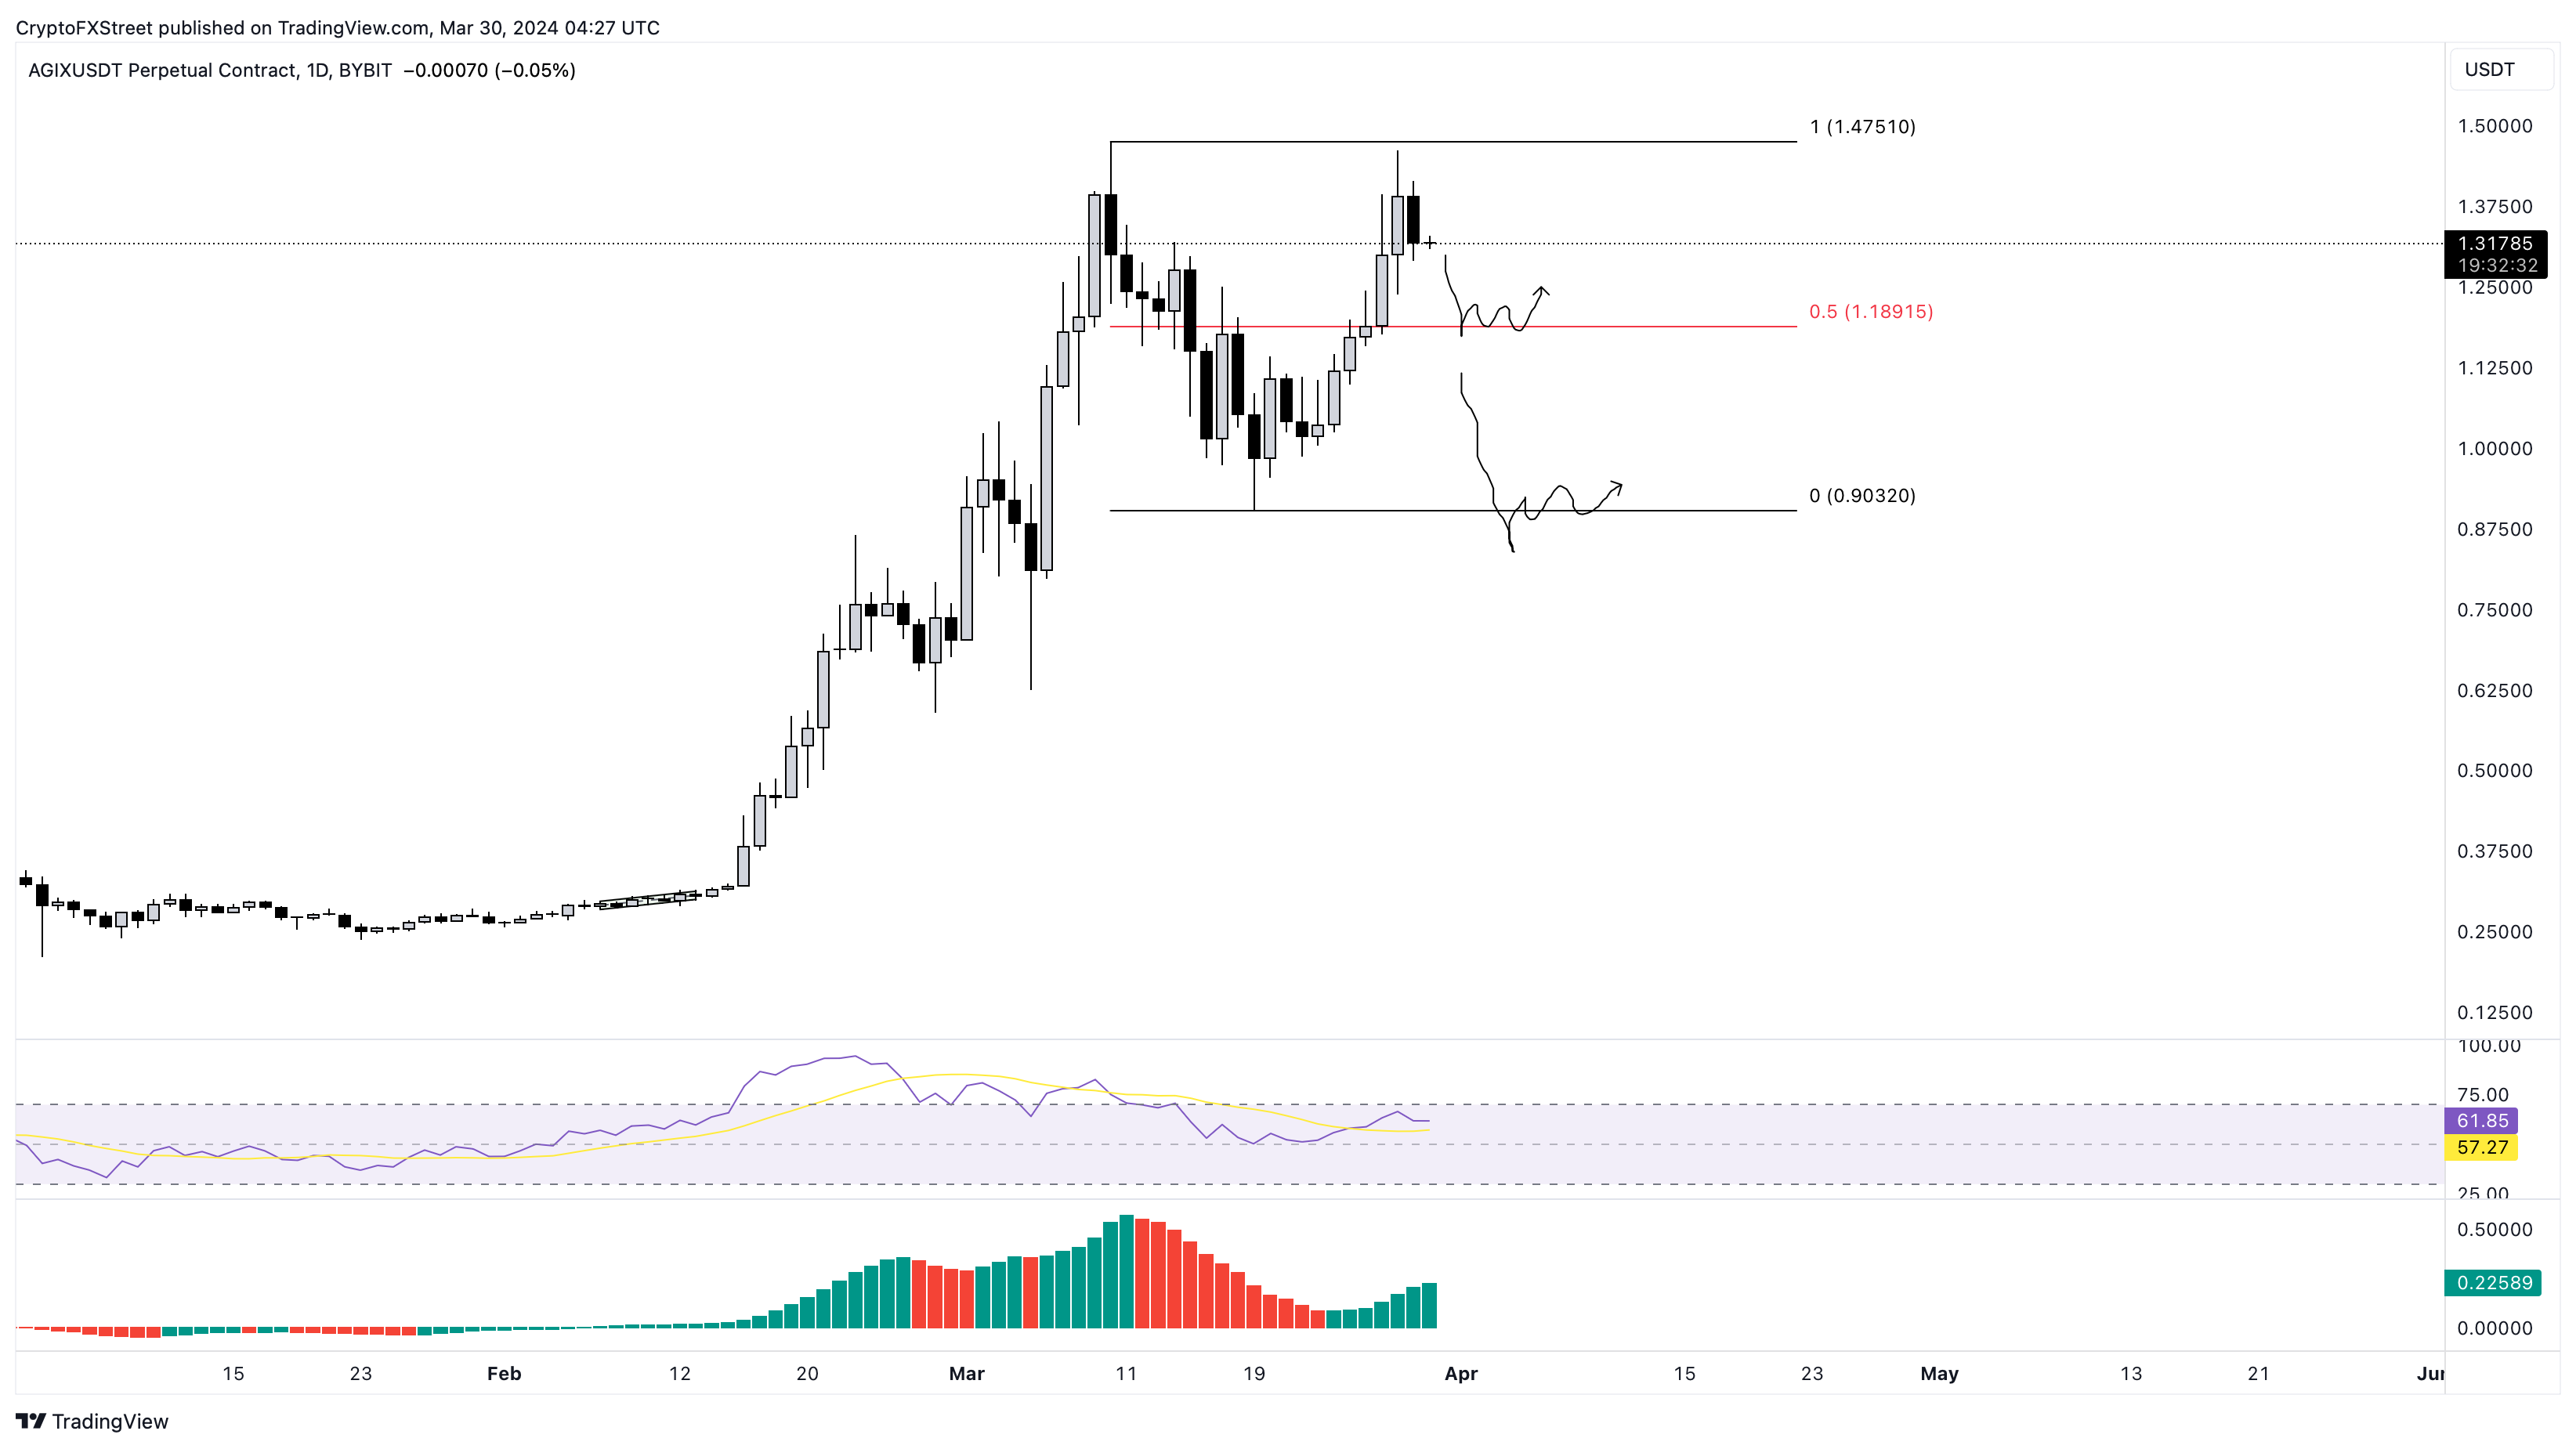
- SingularityNET price trades inside the $0.90 to $1.47 range.
- A correction is plausible, considering the bearish divergence sell signal on the daily chart.
- Investors can expect AGIX to sweep the $0.90 level in a worst-case scenario.
SingularityNET (AGIX) price set up a range by mid-March and is currently trading inside it, trying to establish a directional bias. Before AGIX decides on a bias, investors can expect it to resolve the sell signal.
Also read: OCEAN, GRT, FET: Artificial Intelligence projects with high developer activity
SingularityNET price at crossroads
SingularityNET price set up the $0.90 to $1.47 range between March 10 and 19. Since then, AGIX has tried to sweep the range high but has fallen short of bullish momentum due to the market conditions.
Trading at $1.31, SingularityNET price has flashed a bearish divergence sell signal. This setup is obtained when the price sets up a higher high, but the Relative Strength Index (RSI) forms a lower high. The same can be observed with the Awesome Oscillator (AO), another momentum indicator.
Unless the crypto market outlook improves and resumes the bullish trend, SingularityNET price is due for a correction. The best-case scenario for holders would be a bounce off the range’s midpoint at $1.89. But if the selling pressure climbs over the weekend, AGIX could drop 30% or more and sweep the range low at $0.90.

AGIX/USDT 1-day chart
On the contrary, if the market outlook improves, with Bitcoin price heading to the $75,000 or $80,000 levels, SingularityNET price could bounce off the midpoint at $1.18. This recovery rally could put AGIX on the path of an uptrend.
If this development leads to a decisive flip of the $1.47 range high into a support floor, it would invalidate the bearish thesis.


