
- Bitcoin and top altcoins operate in the red on Wednesday as the risk-off sentiment persists.
- Real-world asset tokens such as Sky and Quant rise against the bearish tides, spearheading market gainers.
- AI token FET’s technical outlook reveals a hidden RSI divergence, supporting a double bottom reversal.
The cryptocurrency market consolidates halfway through the week as Bitcoin (BTC) loses steam above $106,000, resulting in a broader pullback. Select real-world asset (RWA) and Artificial Intelligence (AI) tokens surge, ignoring the top altcoins’ struggle to bounce back.
Sky targets $0.10 with key resistance breakout
Sky (SKY) is trading at $0.080, experiencing a surge of over 3% as of the time of writing on Wednesday. The RWA token prints its fifth consecutive bullish candle on the daily chart as it bounces off a local support trendline (formed by connecting lows of February 10, March 12, and April 22).
The Moving Average Convergence/Divergence (MACD) indicator triggers a buy signal as the blue MACD line crosses above the red signal. Alongside the increasing volumes, a green histogram bar resurfaces, supporting the bullish outlook.
The Relative Strength Index (RSI) rises to 66, suggesting a robust bullish momentum at hand with room for growth. However, the RSI is approaching the overbought zone above 70, which warns investors to remain cautious.
A potential breakout of the immediate resistance at $0.082 could pump the SKY prices to the $0.10 psychological level.
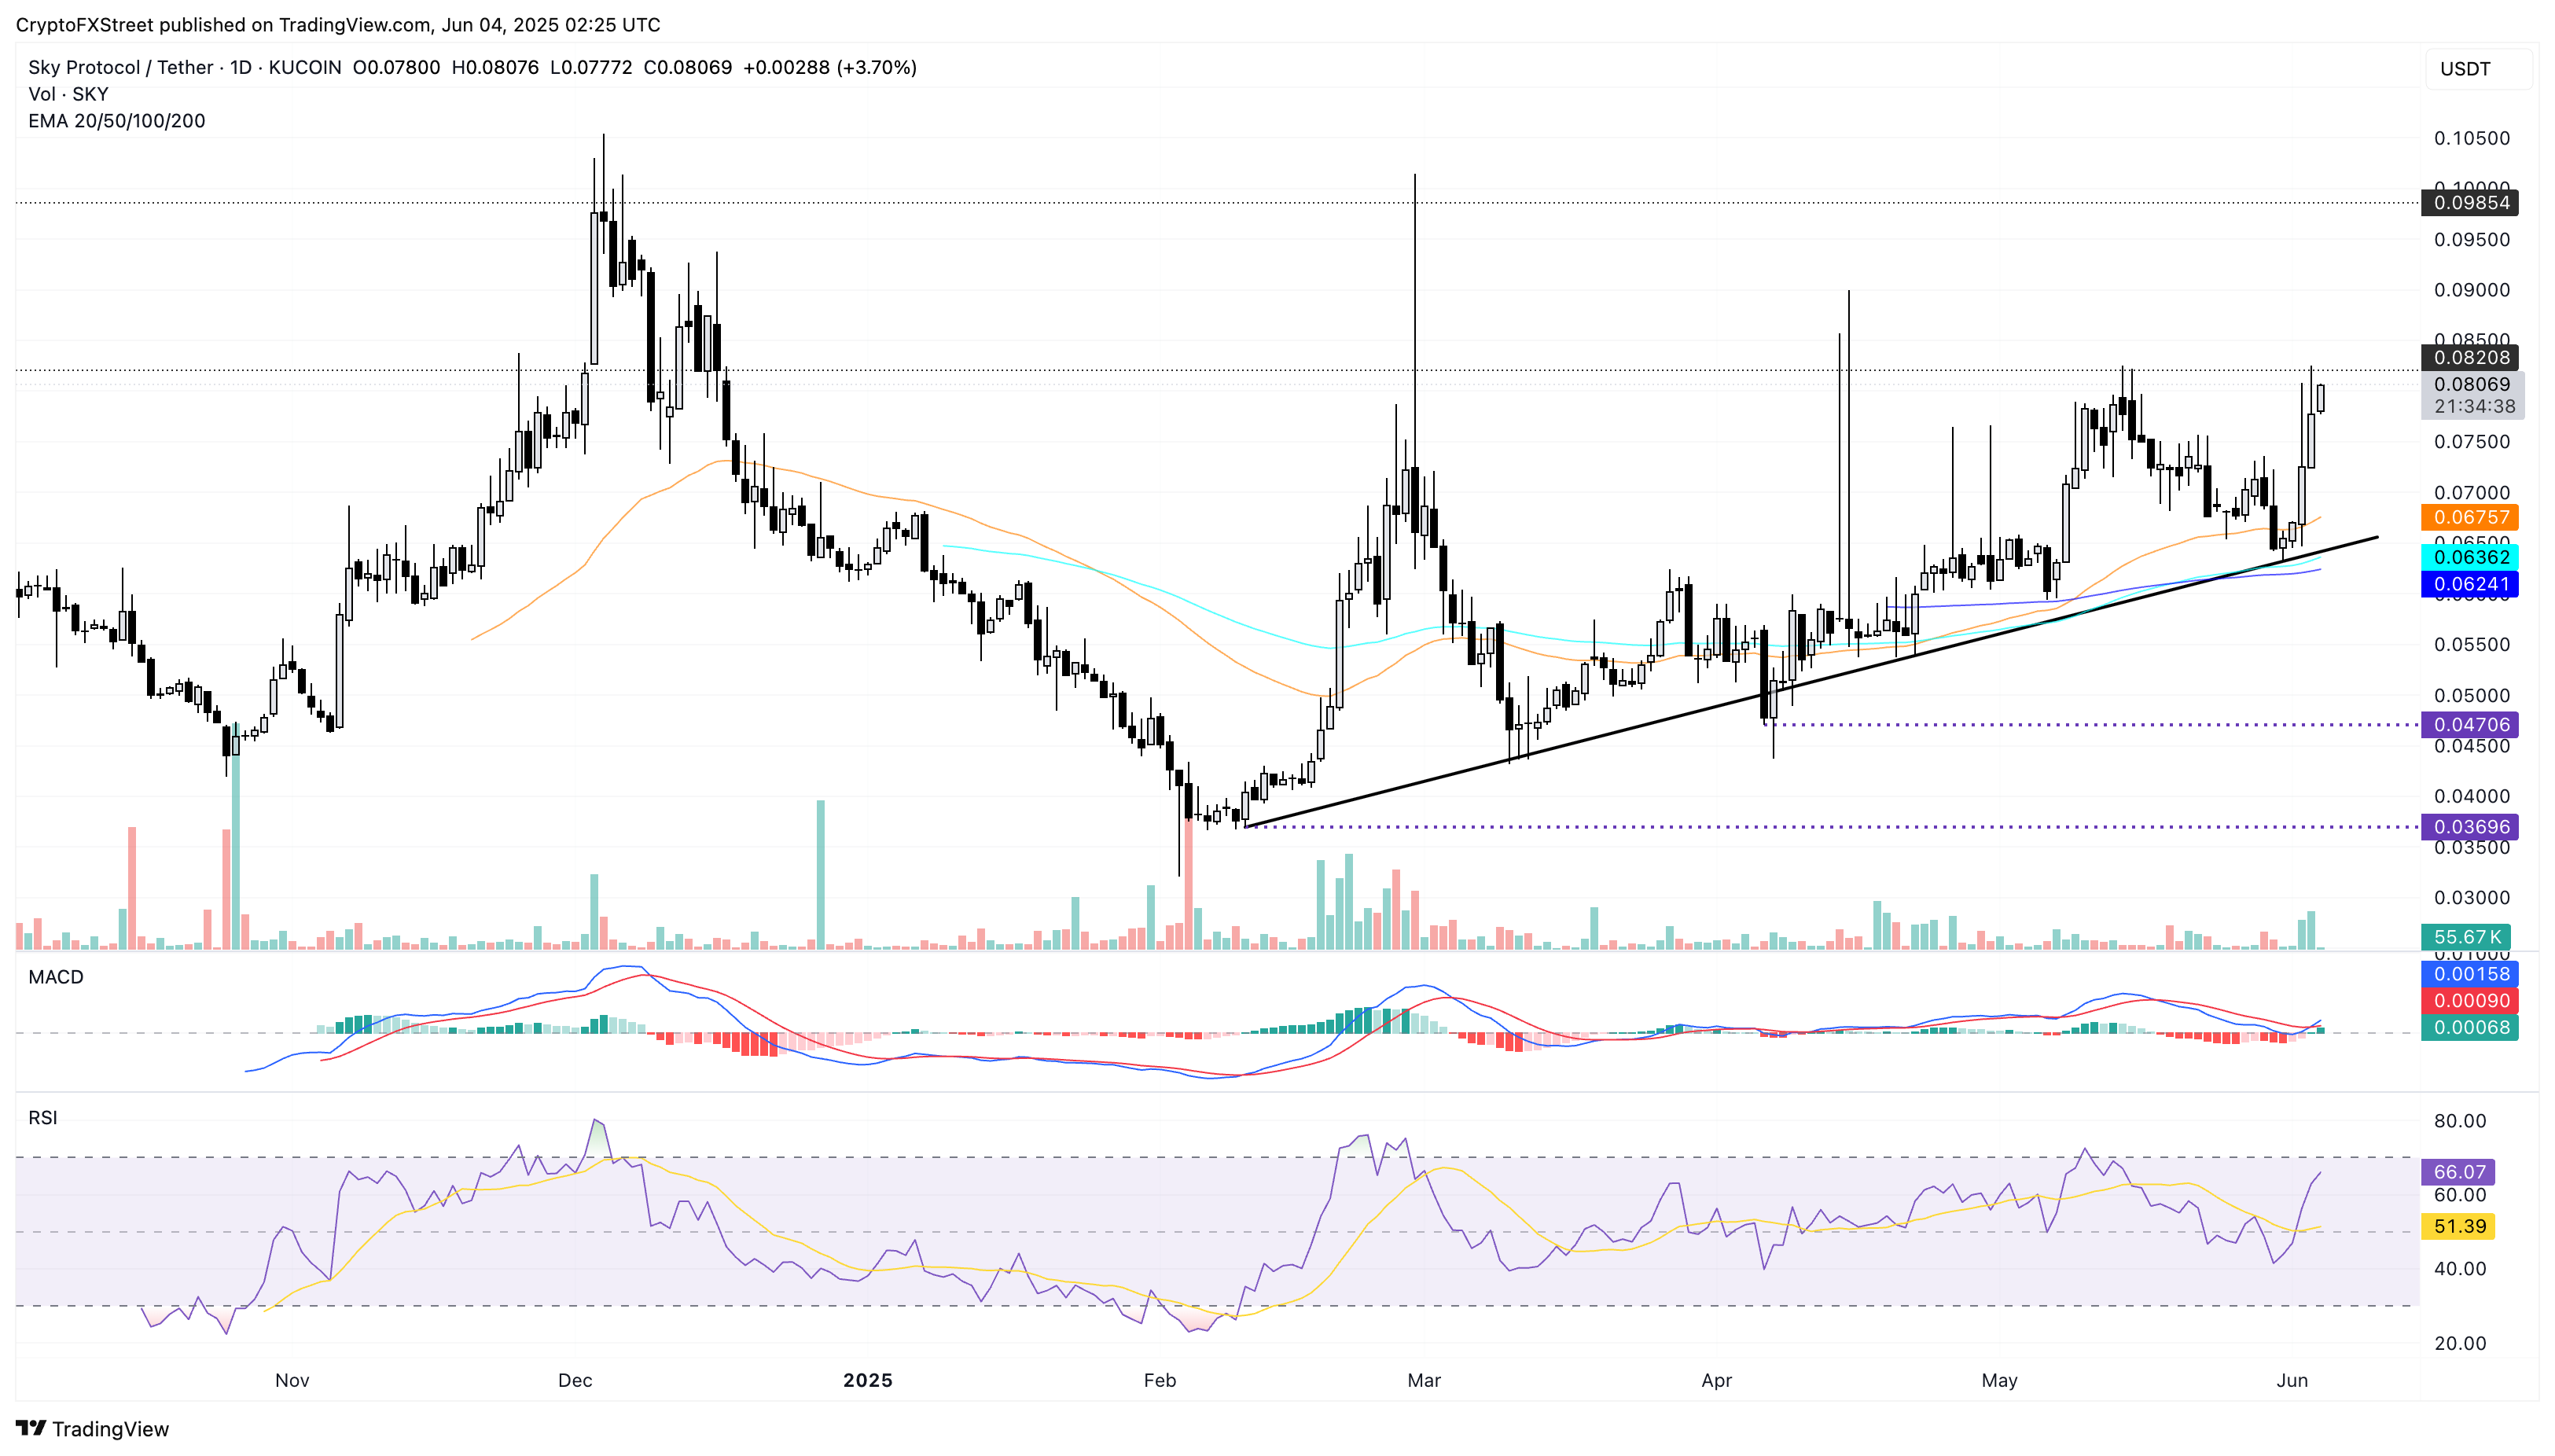
SKY/USDT daily price chart. Source: Tradingview
On the other hand, the 50-day and 200-day Exponential Moving Averages (EMAs) at $0.067 and $0.062, respectively, could absorb a high supply reversal.
Quant holds above key $100 support
Quant (QNT) trades at $116 at press time after a near 8% rise on Tuesday to bounce off a crucial resistance-turned-support zone near $100. With the post-retest reversal, QNT aims to challenge the immediate resistance at $121.
The momentum indicators back a bullish outlook for the RWA token as RSI at 66 hovers under the overbought line, while the MACD and signal line maintain a positive alignment, overcoming the short-term volatility.
Additionally, the 100-day and 200-day EMAs give a bullish crossover, bolstering the trend reversal.
A potential breakout in Quant could reach the next key resistance at $143, highlighted by a short consolidation in early December.
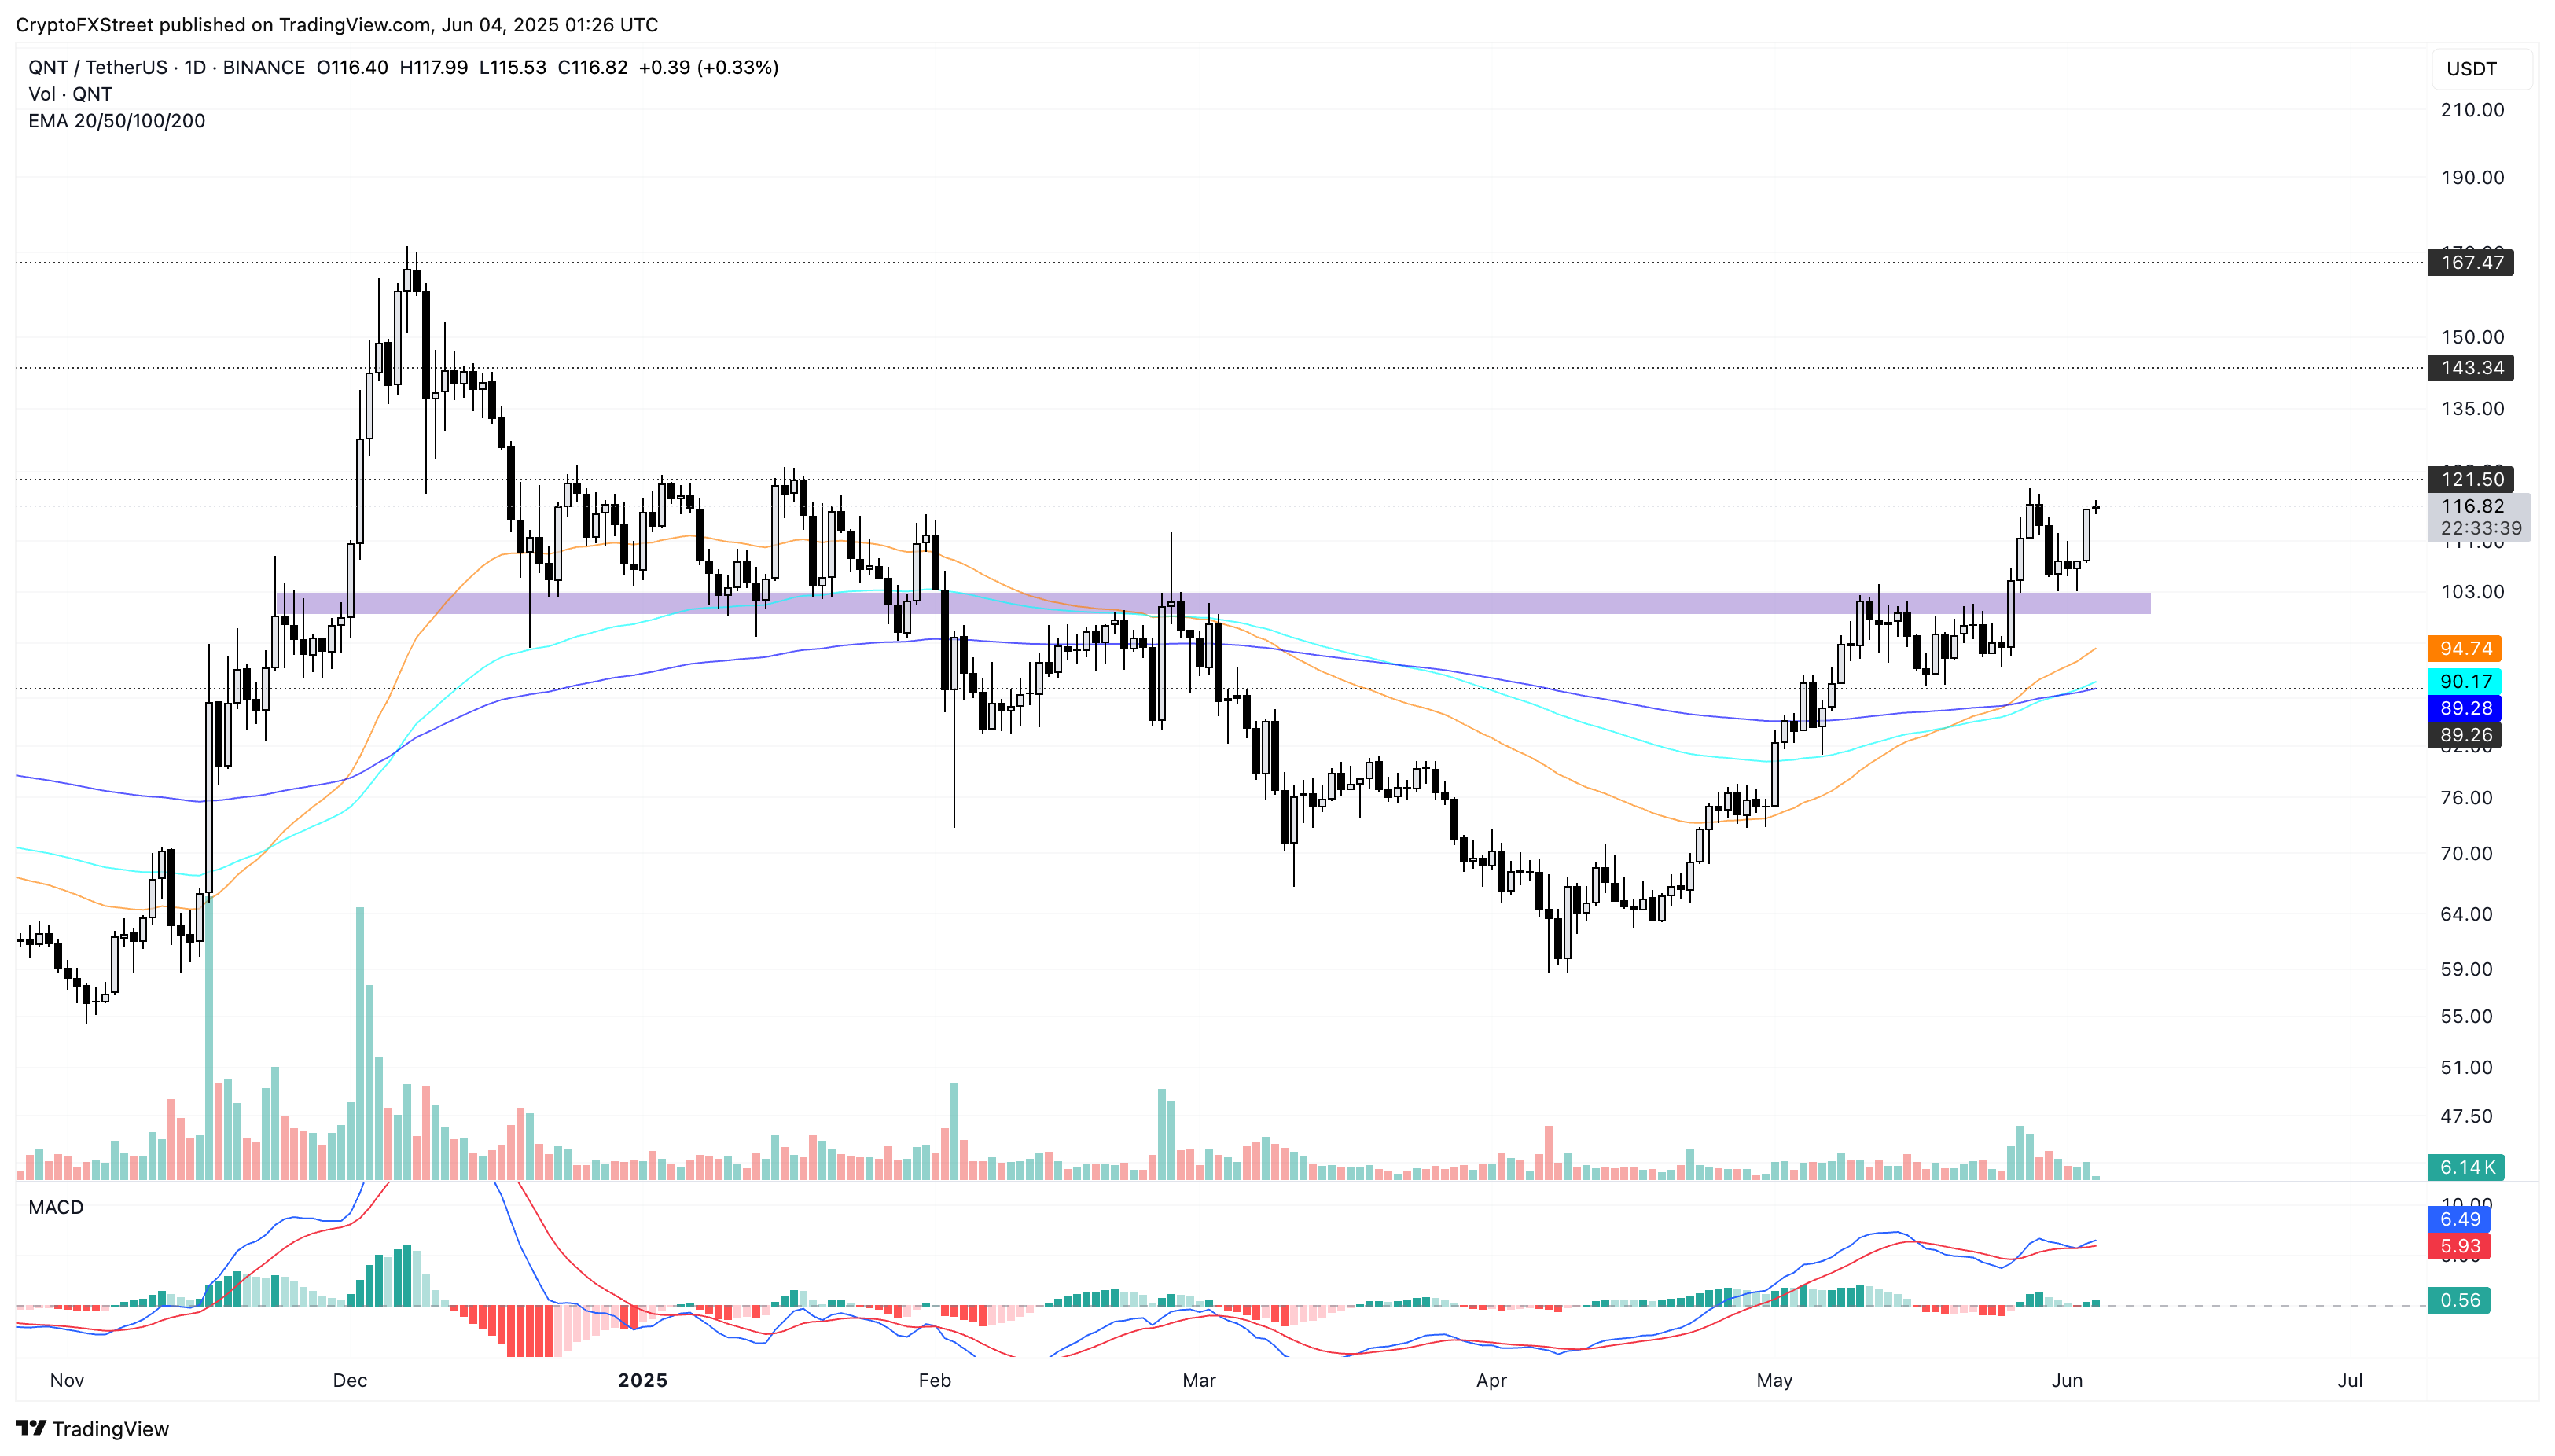
QNT/USDT daily price chart. Source: Tradingview
Conversely, a flip from $121 could result in a pullback to $100.
AI token FET eyes a reversal to $1
The Artificial Superintelligence Alliance (FET) holds the crucial grounds of a $0.70 support floor, with a reversal fueled by multiple long-tailed Doji candles during the weekend. The AI token has soared over 15% from the weekly low at $0.711, aiming to challenge the 200-day EMA at $0.886.
FET’s price action hints at a double bottom reversal as it marked a previous reversal from $0.70 on May 19. The neckline of the bullish pattern lies at the weekly high at $0.935.
The RSI indicator reveals a hidden bullish divergence, as it marks a lower low while FET bounces off $0.70 for the second time. Additionally, the MACD approaches its signal line, hinting at a potential bullish crossover.
A breakout rally above $0.935 could potentially reclaim the $1 mark by testing the January 31 opening price, which is just above $1.
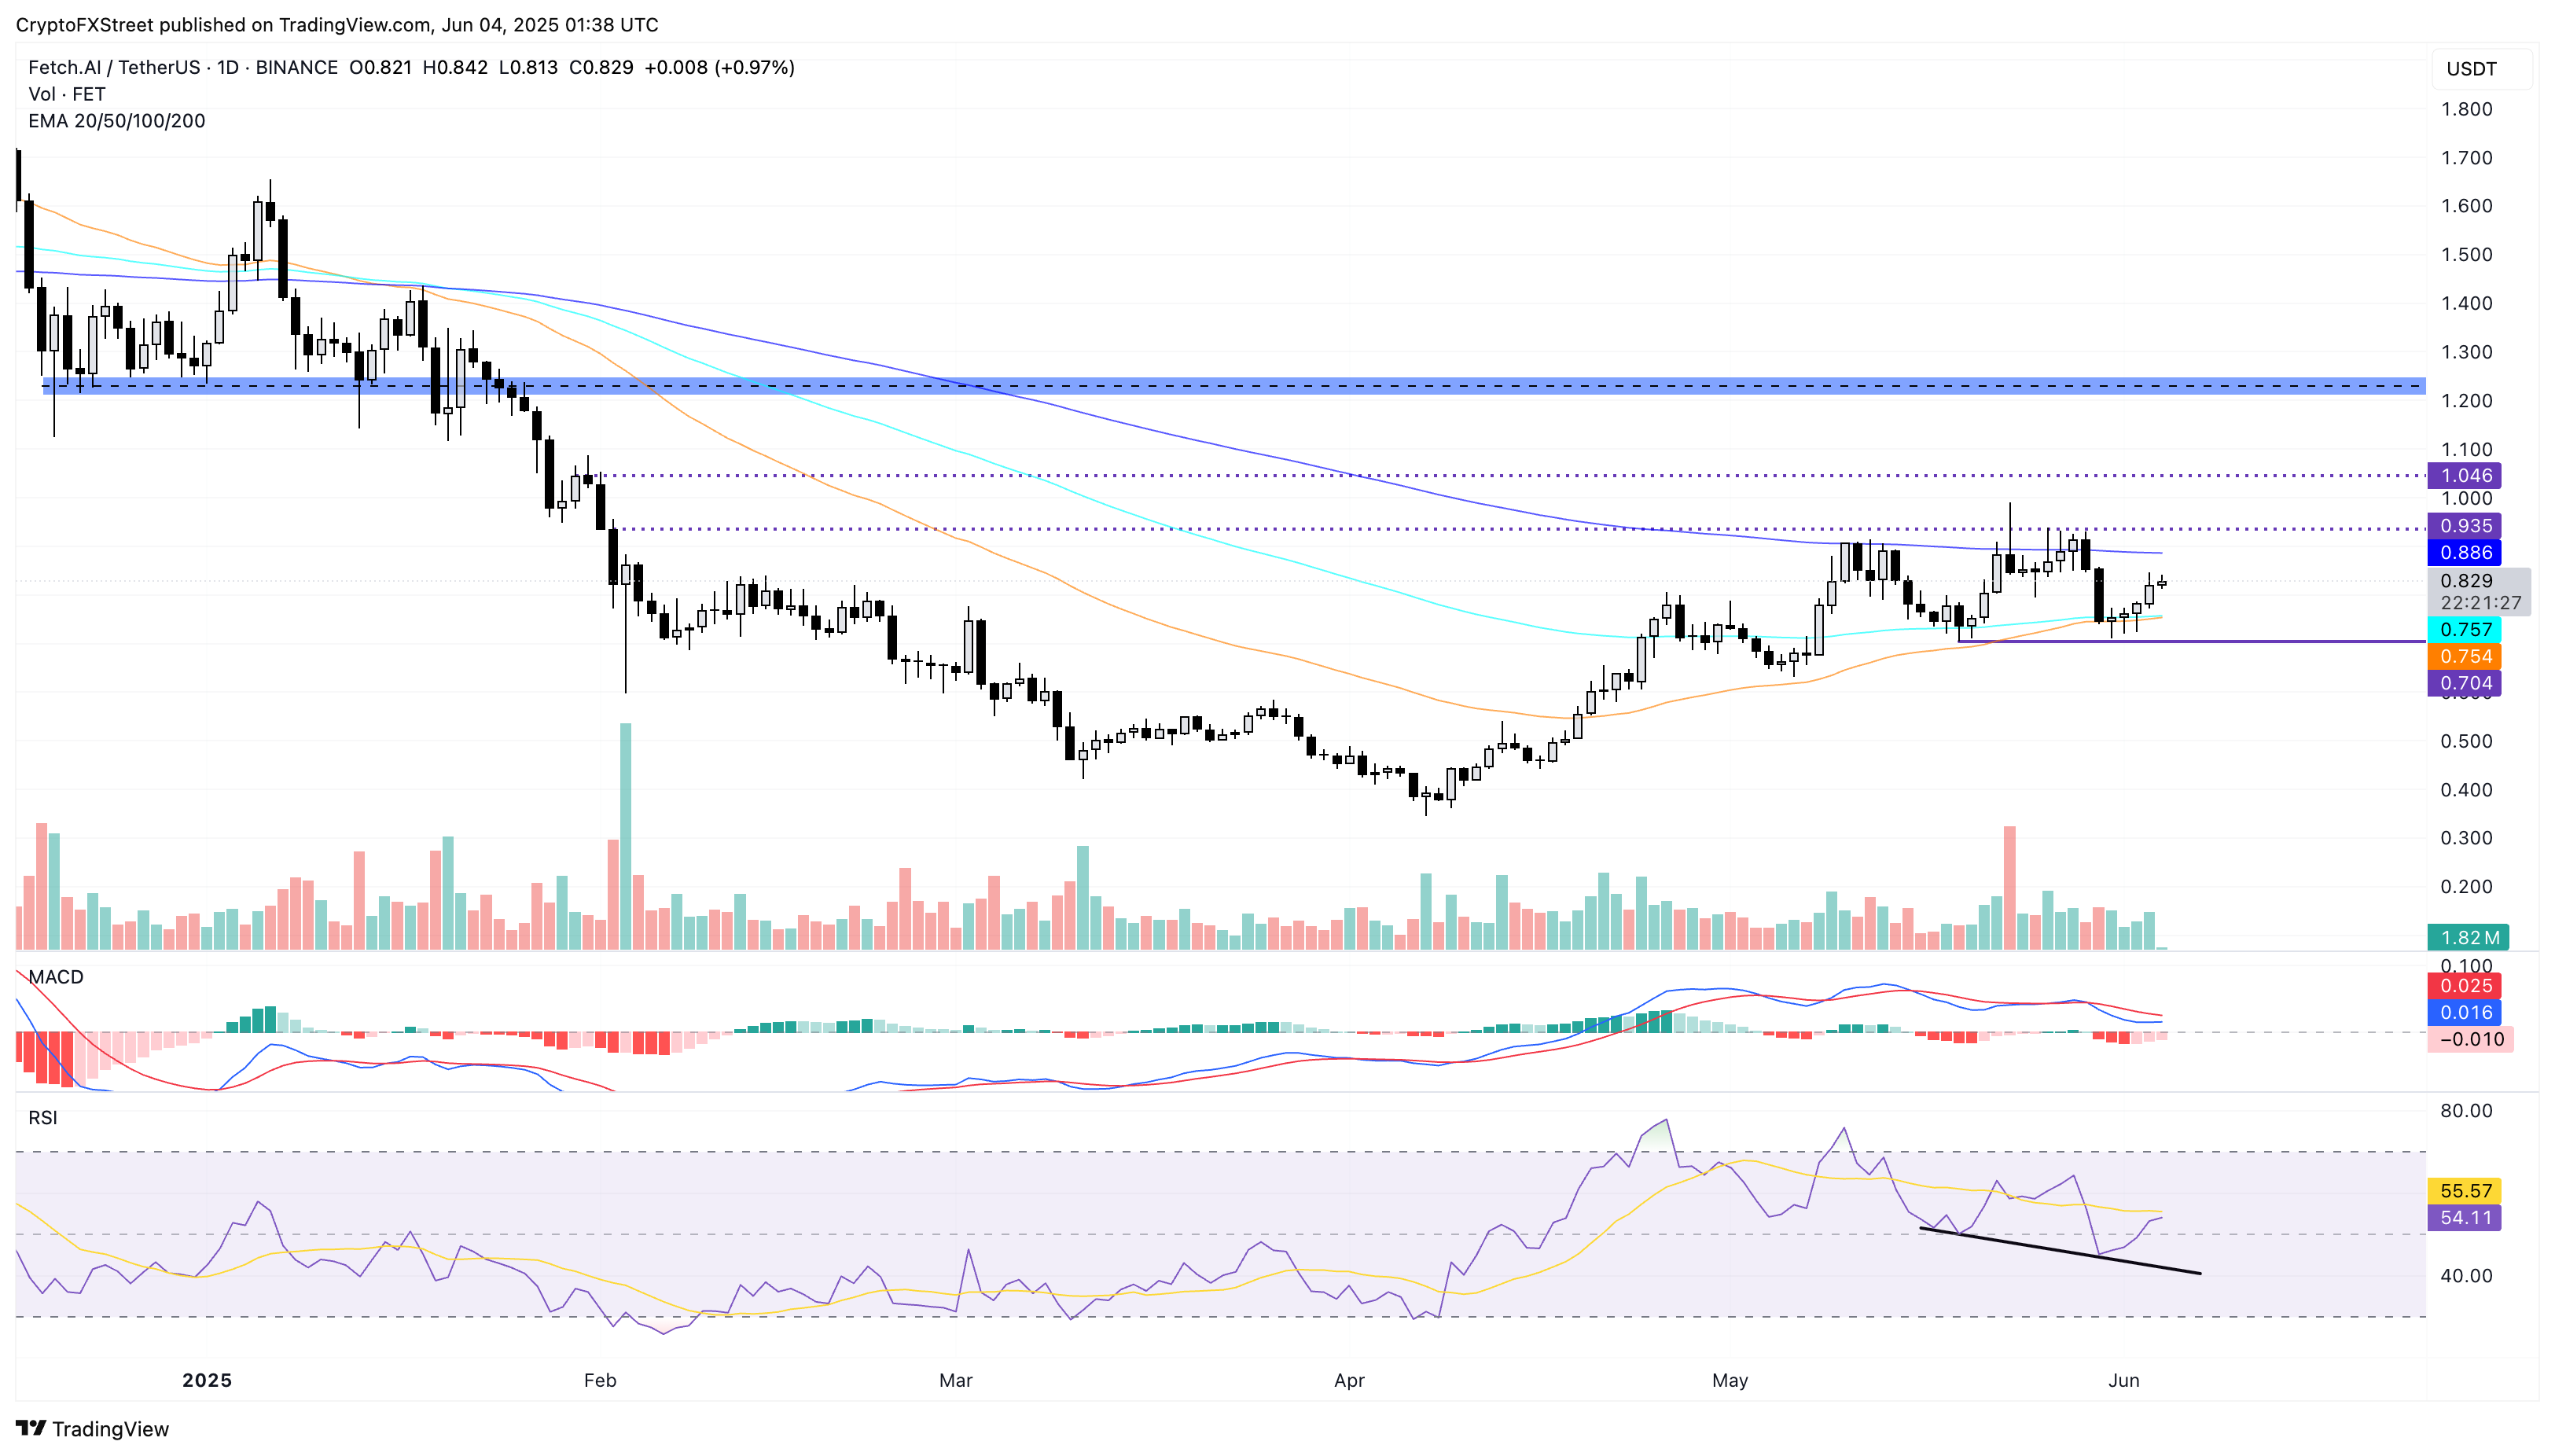
FET/USDT daily price chart. Source: Tradingview
On the flip side, a failure to cross above the $0.935 neckline could extend the consolidation above $0.70 with another pullback.