- SPX6900 meme coin corrects on Monday after an over 13% jump the previous week.
- With a golden cross between the 50-day and 200-day EMAs, SPX6900 meme coin’s technical outlook holds a bullish narrative.
- The derivatives data suggests mixed sentiments despite a near 10% rise in SPX Open Interest.
SPX6900 (SPX) meme coin edges lower on Monday after a 13% surge the previous week. However, SPX still holds over 6% gains over the last 24 hours at press time. Despite the short-term struggle to hold above $1, the technical outlook, with an EMA crossover and a pattern breakout, alongside the soaring Open Interest (OI), suggests a continuation of the bullish trend.
SPX breaks above a rounding bottom pattern
The SPX6900 meme coin surged nearly 80% in May, following a 25% rise in April, showcasing a bullish trend in motion. The recovery rally in the SPX breaks above a U-shaped price pattern, known as a rounding bottom, as shown in the daily price chart below.
The price zone between $0.89 and $0.94 acted as the neckline of the bullish reversal pattern. As the meme coin’s rally peaked at $1.22 before taking a pullback to retest $0.92 or the 50% Fibonacci level, extending from $1.55 on January 6 to $0.29 on March 11. Notably, the previously mentioned supply zone overlaps the 50% Fibonacci level, reflecting a confluence of key support elements that increases the chances of a bullish reversal.
However, the Relative Strength Index (RSI) at 60 retraces down from the overbought zone, suggesting that bullish momentum is gradually declining.
Despite the short-term loss in momentum, the 50-day and 200-day Exponential Moving Average (EMA) gave a golden cross on Sunday. This marks the recent bullish recovery outgrowing the longer-term price movement.
With the long-tailed candles on the weekend, SPX shows readiness to take off for a post-retest reversal of the rounding bottom breakout. According to the Fibonacci levels, the $1.28 mark, which aligns with the 78.6% retracement, is the immediate resistance.
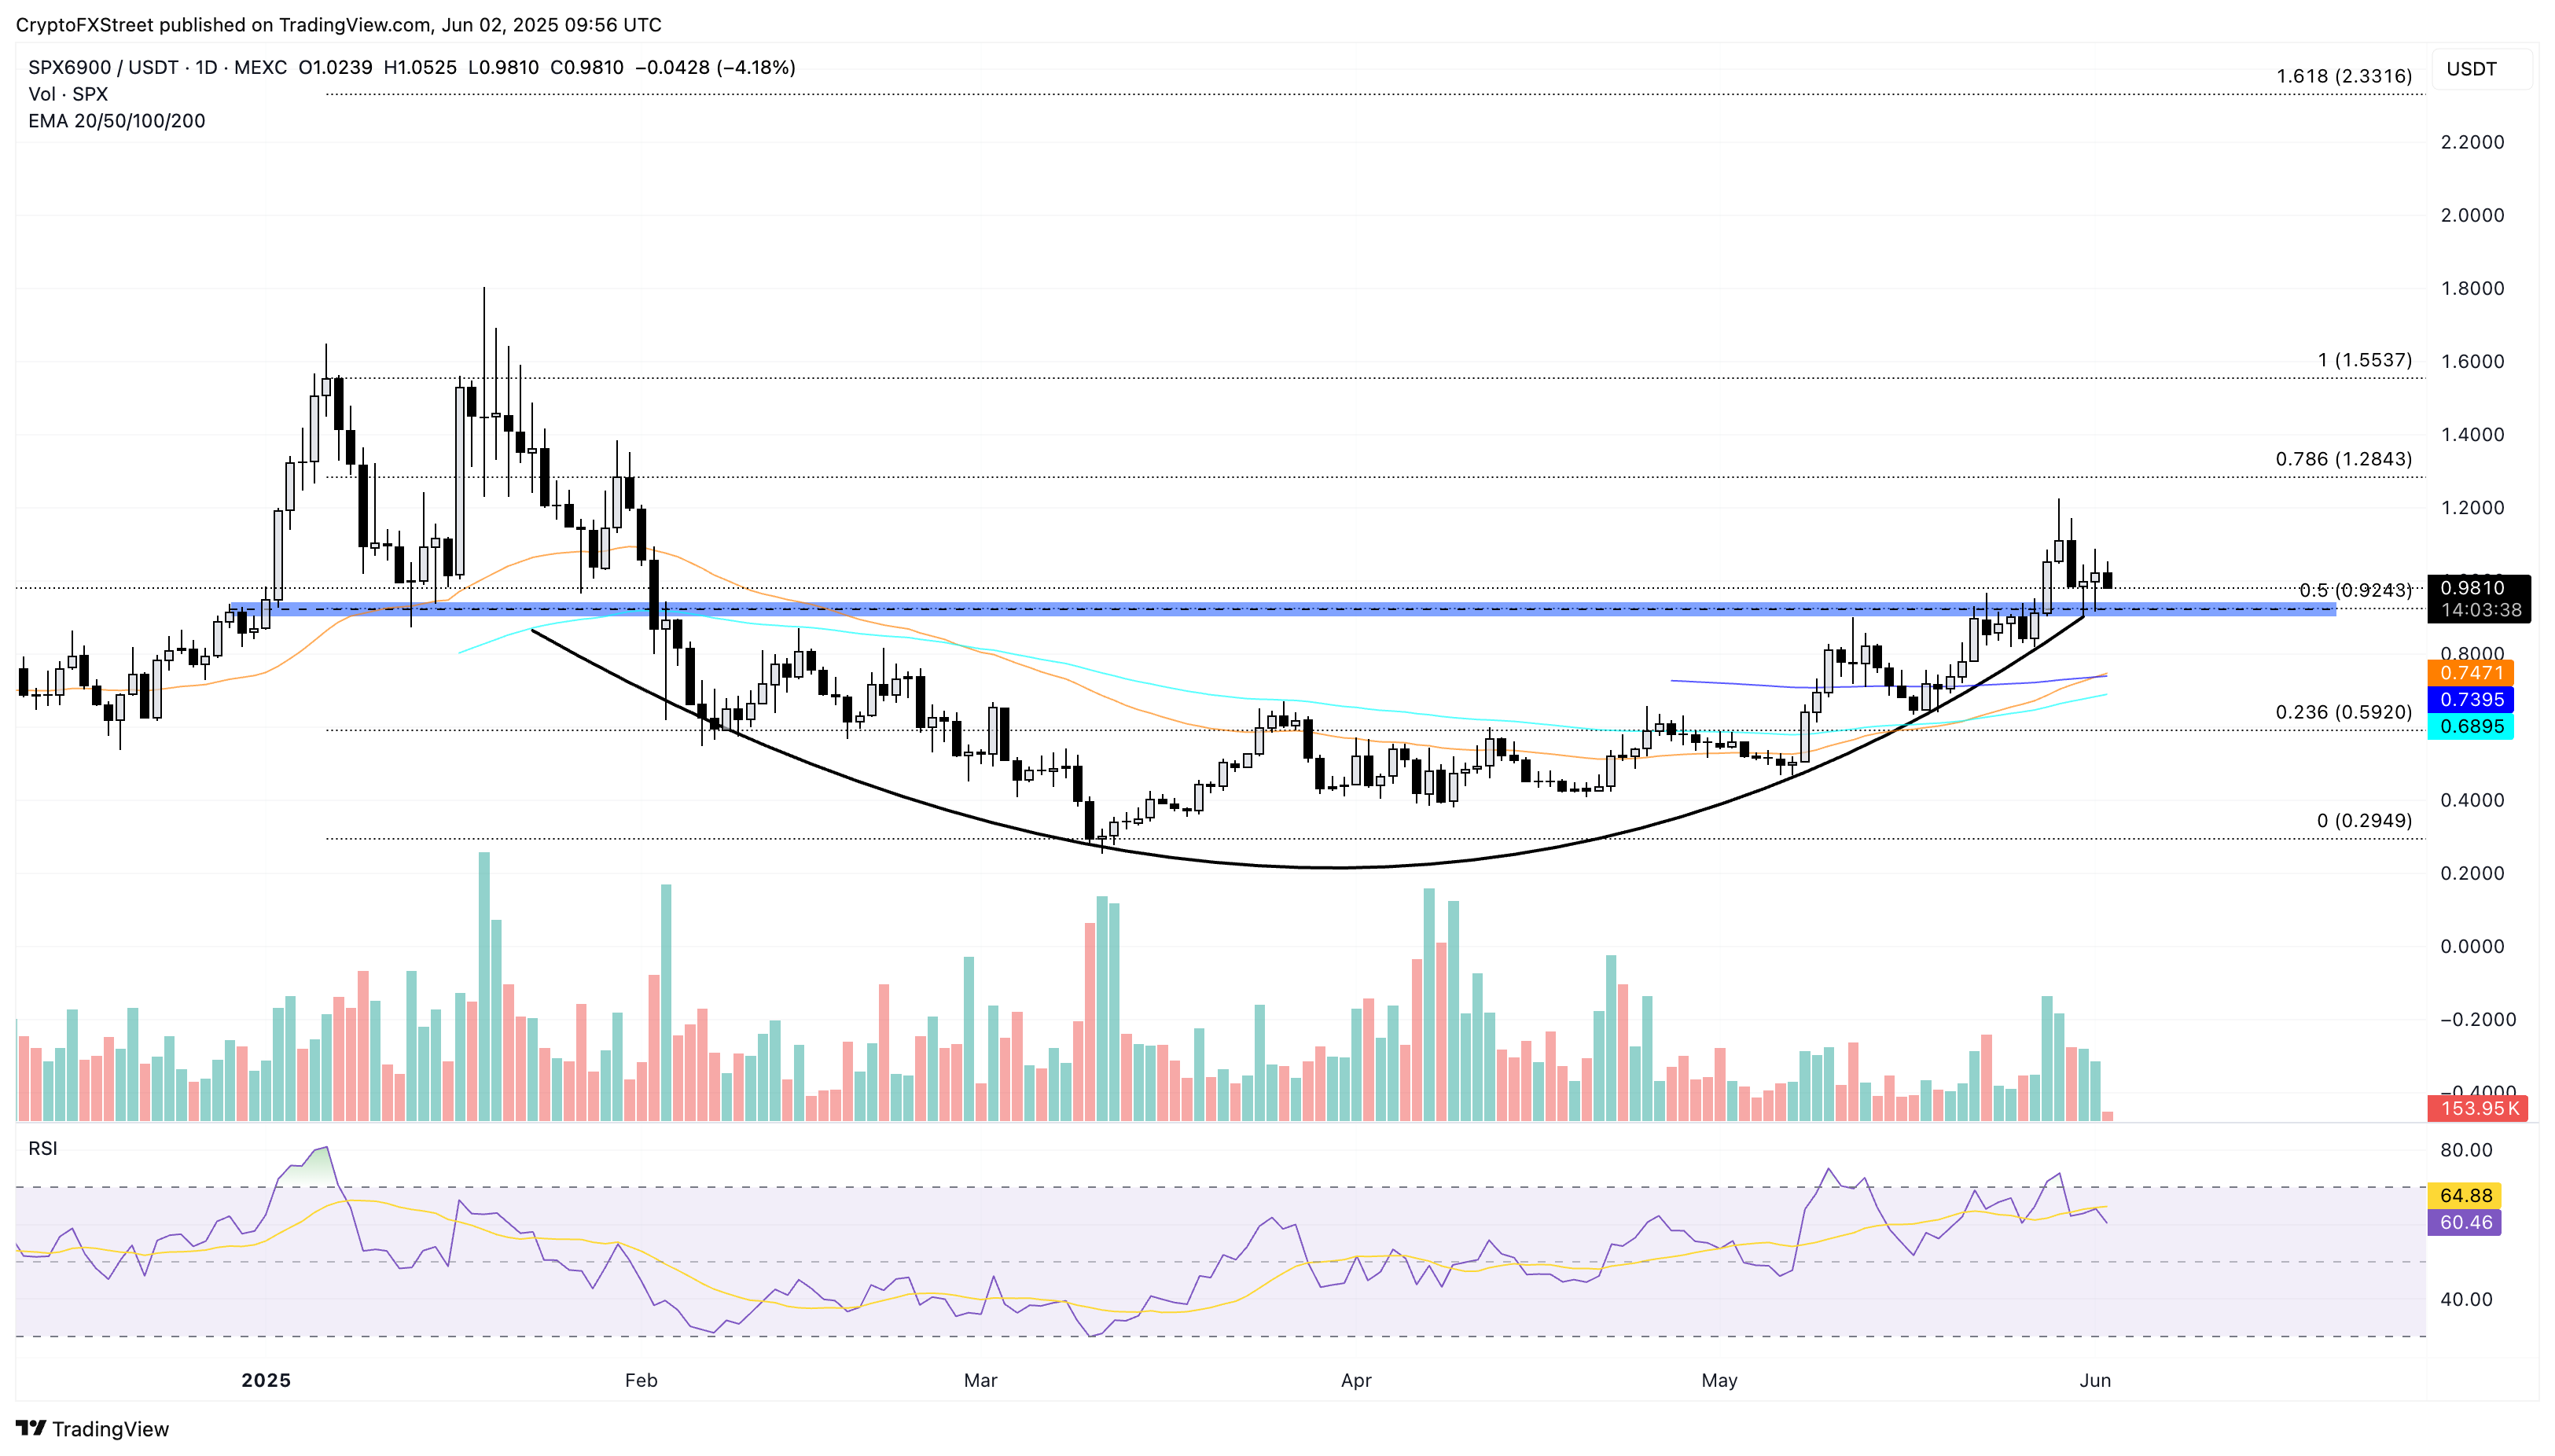
SPX/USDT daily price chart. Source: Tradingview
Conversely, a clean push in SPX below $0.90, leading to a daily candle close, will invalidate the bullish pattern. Thus, increasing the likelihood of the 23.6% Fibonacci level retest at $0.59. Hence, traders can wait for a closing under $0.90 or above the $1 mark before deciding the next wave in SPX to capture.
Open interest soars 10% as optimism emerges for SPX
Coinglass data shows SPX6900 meme coin witnessing a 10% spike in OI, reaching $68.22 million. This suggests that the interest of derivative traders has significantly increased in the meme coin.
Concurrent with the OI surge, the OI-weighted funding rate remains at 0.0059%, indicating a sustained bullish inclination among traders. Additionally, the volume of SPX has increased by 13.47% to $145 million, indicating projected increased trading activity.
The 24-hour liquidation data points to a larger wipeout of bullish positions worth $74.88K, while the short liquidation is at $54.85K. Consistent with the exit of bulls, the long/short ratio at 0.9881 reveals a slightly larger number of short positions amid rising OI and stable funding rates conditions.
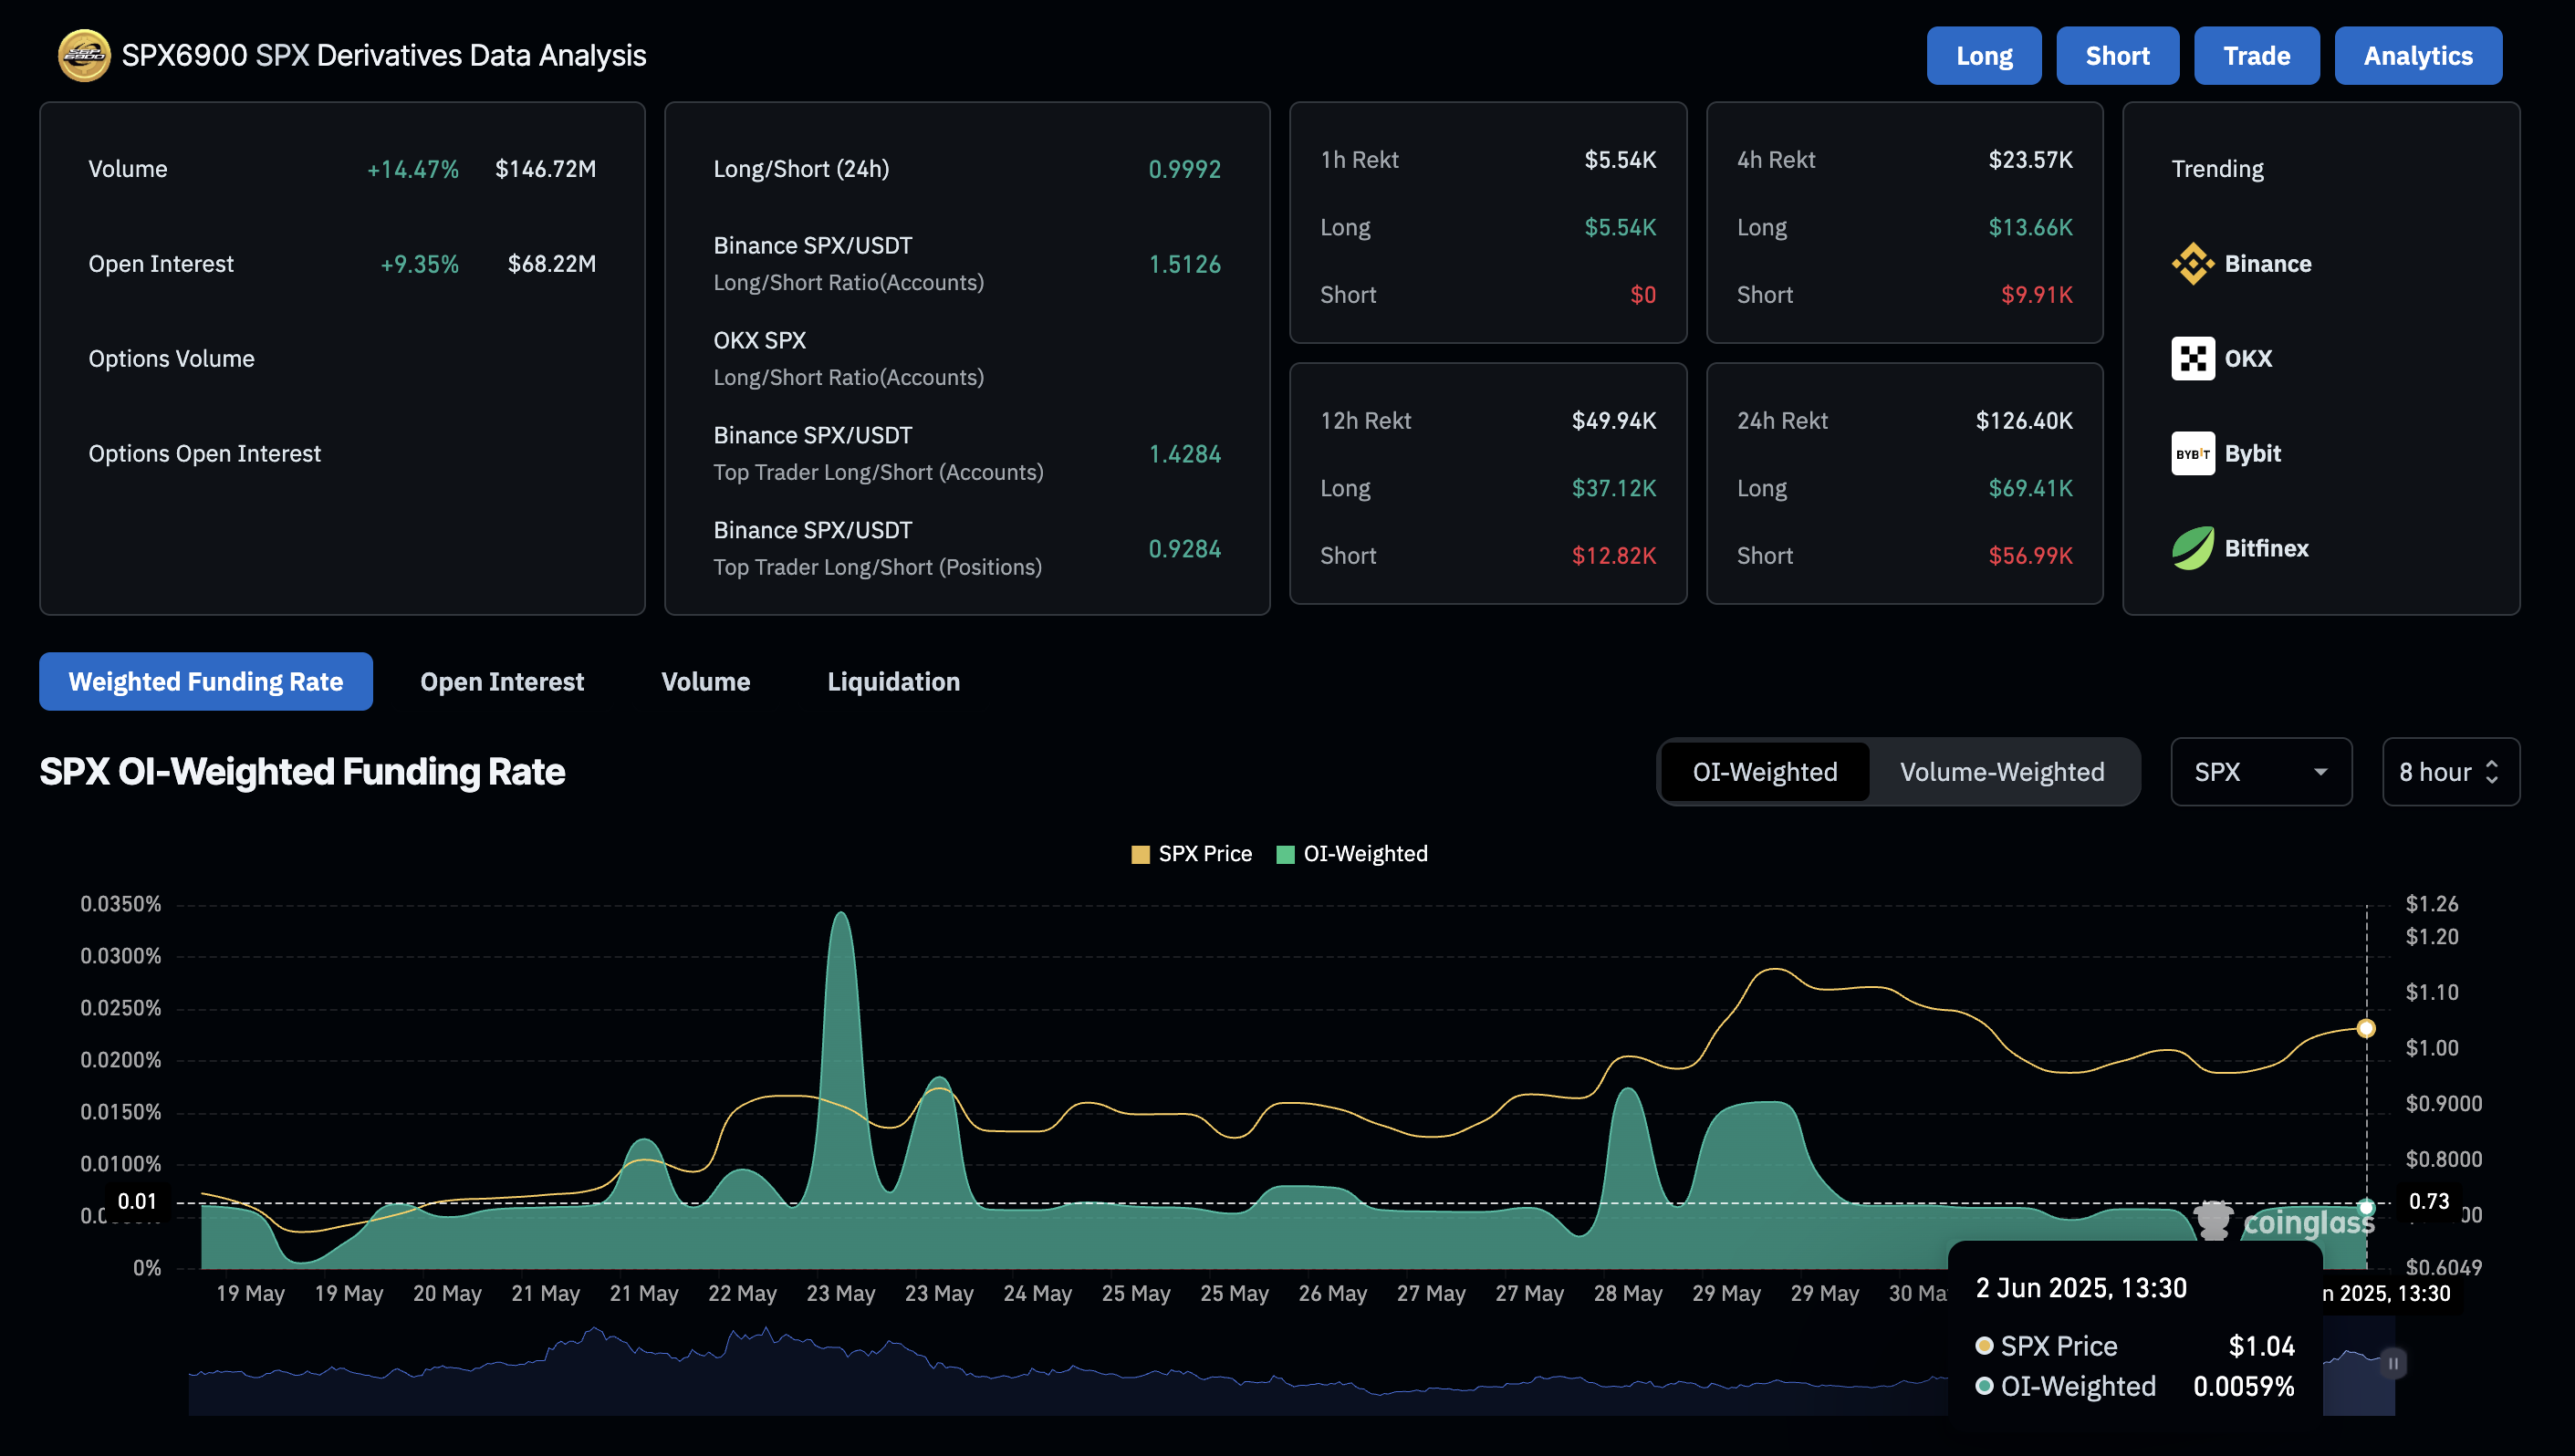
SPX Derivatives Data. Source: Coinglass
In a nutshell, the mixed sentiments of derivatives data and the bullish, reversal-inclined technical outlook suggest an increased chance of resurfacing above $1.