- GBP/USD stabilizes at 1.2858 after sellers failed to clear the 1.2900 level.
- Momentum favors buyers, but long positions in Sterling risk vulnerability if BoE cuts rates.
- Key support at 1.2800, with further downside under 50-DMA at 1.2775 and potential gains above 1.2900.
The Pound Sterling clings to minuscule gains on Friday after the latest inflation report in the United States (US) reinforced investors’ bets that the US Federal Reserve could begin slashing rates at the September monetary policy meeting. At the time of writing, the GBP/USD trades at 1.2858, virtually unchanged.
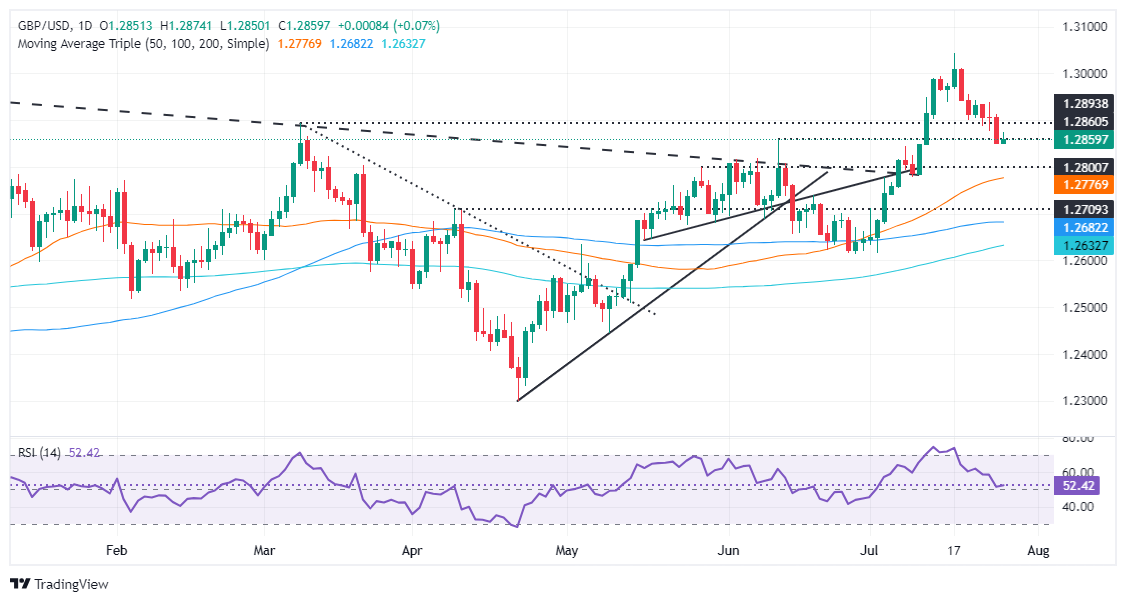
GBP/USD Price Analysis: Technical outlook
The GBP/USD consolidated at around 1.2850 after sellers strengthened and pushed the exchange rate past the 1.2900 figure, which was unsuccessfully cleared during the first three days of the week. Despite this, momentum is still in buyers’ favor, as depicted by the Relative Strength Index (RSI), though extremely long positions on Sterling could leave traders vulnerable if the Bank of England (BoE) cuts rates next week.
On the downside, the GBP/USD will face stir support at 1.2800. Once cleared, further downside lies under the 50-day moving average (DMA) at 1.2775, followed by the 1.2700 mark. Below this, the 100-DMA hovers at 1.2681, and the 200-DMA at 1.2626.
Conversely, if buyers lift the pair above 1.2900, further gains lie overhead. The July 24 peak at 1.2937 could be tested, followed by the psychological 1.2950 and 1.3000 levels.
GBP/USD Price Action – Daily Chart
British Pound PRICE Today
The table below shows the percentage change of British Pound (GBP) against listed major currencies today. British Pound was the strongest against the Canadian Dollar.
| USD | EUR | GBP | JPY | CAD | AUD | NZD | CHF | |
|---|---|---|---|---|---|---|---|---|
| USD | -0.11% | -0.07% | -0.14% | 0.15% | -0.24% | -0.08% | 0.13% | |
| EUR | 0.11% | 0.04% | -0.03% | 0.29% | -0.14% | 0.05% | 0.24% | |
| GBP | 0.07% | -0.04% | -0.08% | 0.24% | -0.18% | -0.00% | 0.19% | |
| JPY | 0.14% | 0.03% | 0.08% | 0.27% | -0.10% | 0.05% | 0.26% | |
| CAD | -0.15% | -0.29% | -0.24% | -0.27% | -0.41% | -0.24% | -0.04% | |
| AUD | 0.24% | 0.14% | 0.18% | 0.10% | 0.41% | 0.18% | 0.39% | |
| NZD | 0.08% | -0.05% | 0.00% | -0.05% | 0.24% | -0.18% | 0.19% | |
| CHF | -0.13% | -0.24% | -0.19% | -0.26% | 0.04% | -0.39% | -0.19% |
The heat map shows percentage changes of major currencies against each other. The base currency is picked from the left column, while the quote currency is picked from the top row. For example, if you pick the British Pound from the left column and move along the horizontal line to the US Dollar, the percentage change displayed in the box will represent GBP (base)/USD (quote).